


For years now, I've wanted to invest in farmland.
Farmland investing is a unique strategy with much to offer real estate investors.
As a property whose value generally doesn't move in correlation with the rest of the real estate market, a good piece of farmland is a VERY solid place to park your money.
Farmland is one of the few passive real estate investments, requires very little hands-on ‘management' from the owner, and has far more demand than supply. I wouldn't mind having a portfolio made up entirely of farmland if I could.
One of the tricks to getting started in this real estate niche is figuring out which market you should invest in. Certain risks and rewards are inherent in any area you choose, and several variables to consider in the search for a property that will deliver the best possible return on investment.
Starting the Search
To make well-informed decisions, having plenty of relevant data at your disposal is important.
With this in mind, we will look at several nationwide maps that explain the important variables that give farmland its value.
These maps can provide helpful visual data that displays which areas of the United States are the most (and least) ideal for farming.
Also, it's important to recognize that not all crops are created equal. Some plants may thrive in drier conditions, while others may do well in different soil types. Some may need more sunlight than others, and some may need warmer (or cooler) climates.
It's worth thinking about which crops are likely to be grown on the property you have in mind (along with the expected crop yields and lease prices those types of farmland are likely to generate).
RELATED: The Truth About Land Investing: 15 Warning Signs to Watch For When Buying Vacant Land
1. Drought Monitor Map
This Drought Monitor Map is an ongoing project from Jessica Blunden at the University of Nebraska-Lincoln. This fantastic resource lays out a very up-to-date map (updated each week) showing which areas of the United States have been adversely affected by drought.
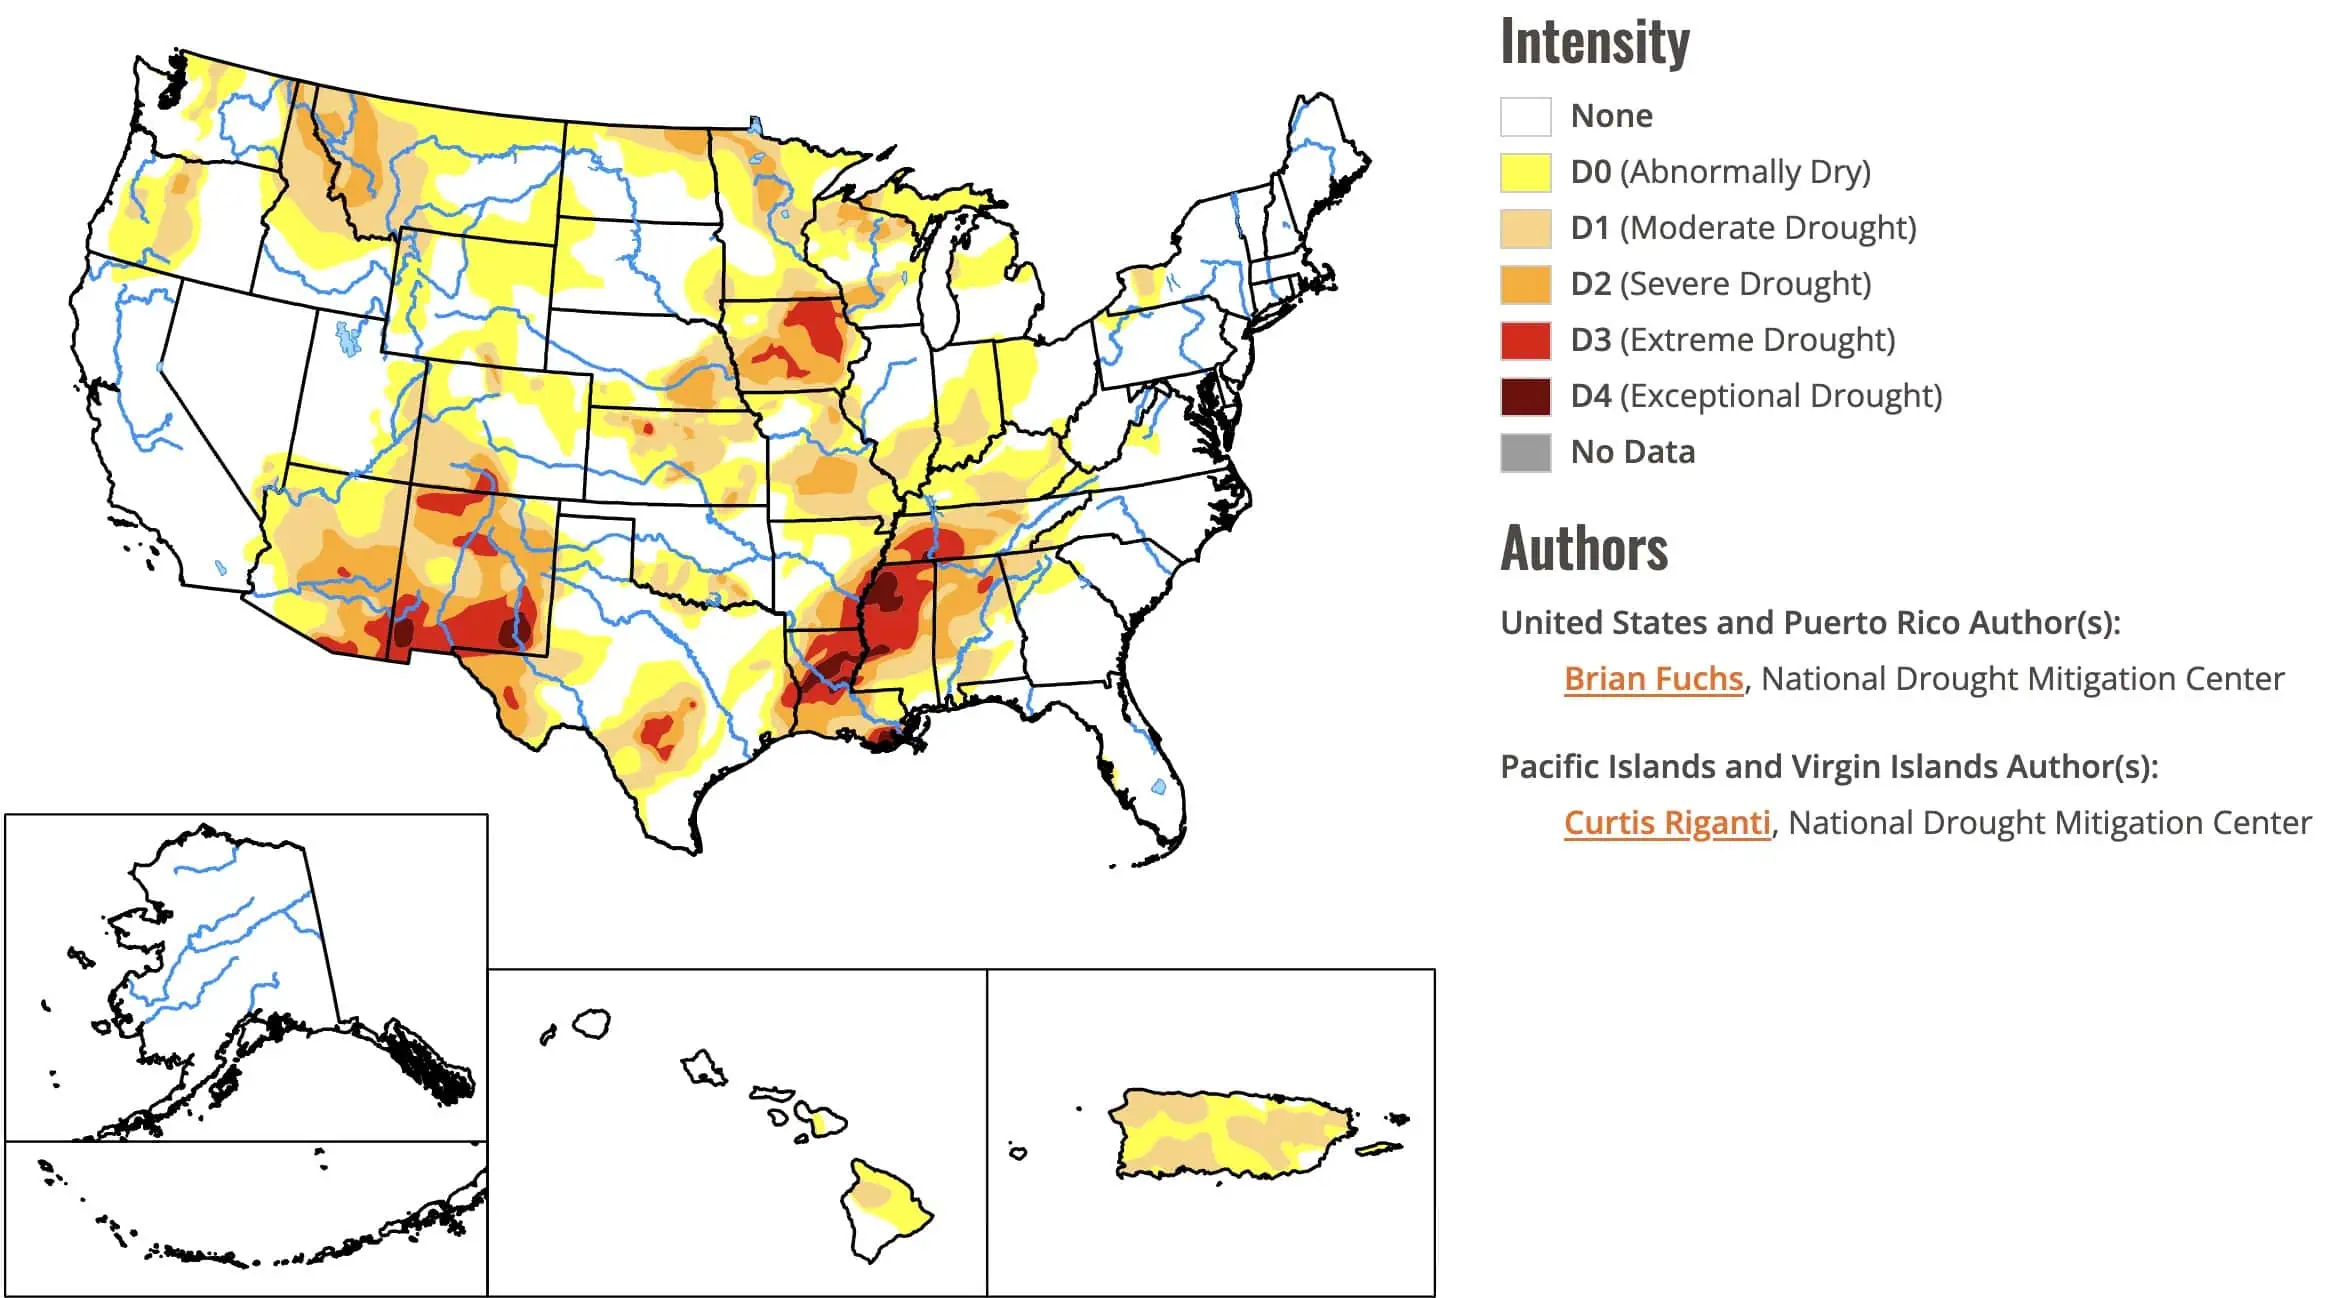
The U.S. Drought Monitor is jointly produced by the National Drought Mitigation Center at the University of Nebraska-Lincoln, the United States Department of Agriculture, and the National Oceanic and Atmospheric Administration. Map courtesy of NDMC-UNL.
The real beauty behind this map is that it doesn't just stop with a high-level, nationwide snapshot of the country. You can drill down MUCH deeper to see data tables dating back several years; you can evaluate a time series by state, region, and even county (among many other options). You can export most of this data for further analysis and even download KMZ files to your computer to use with Google Earth.
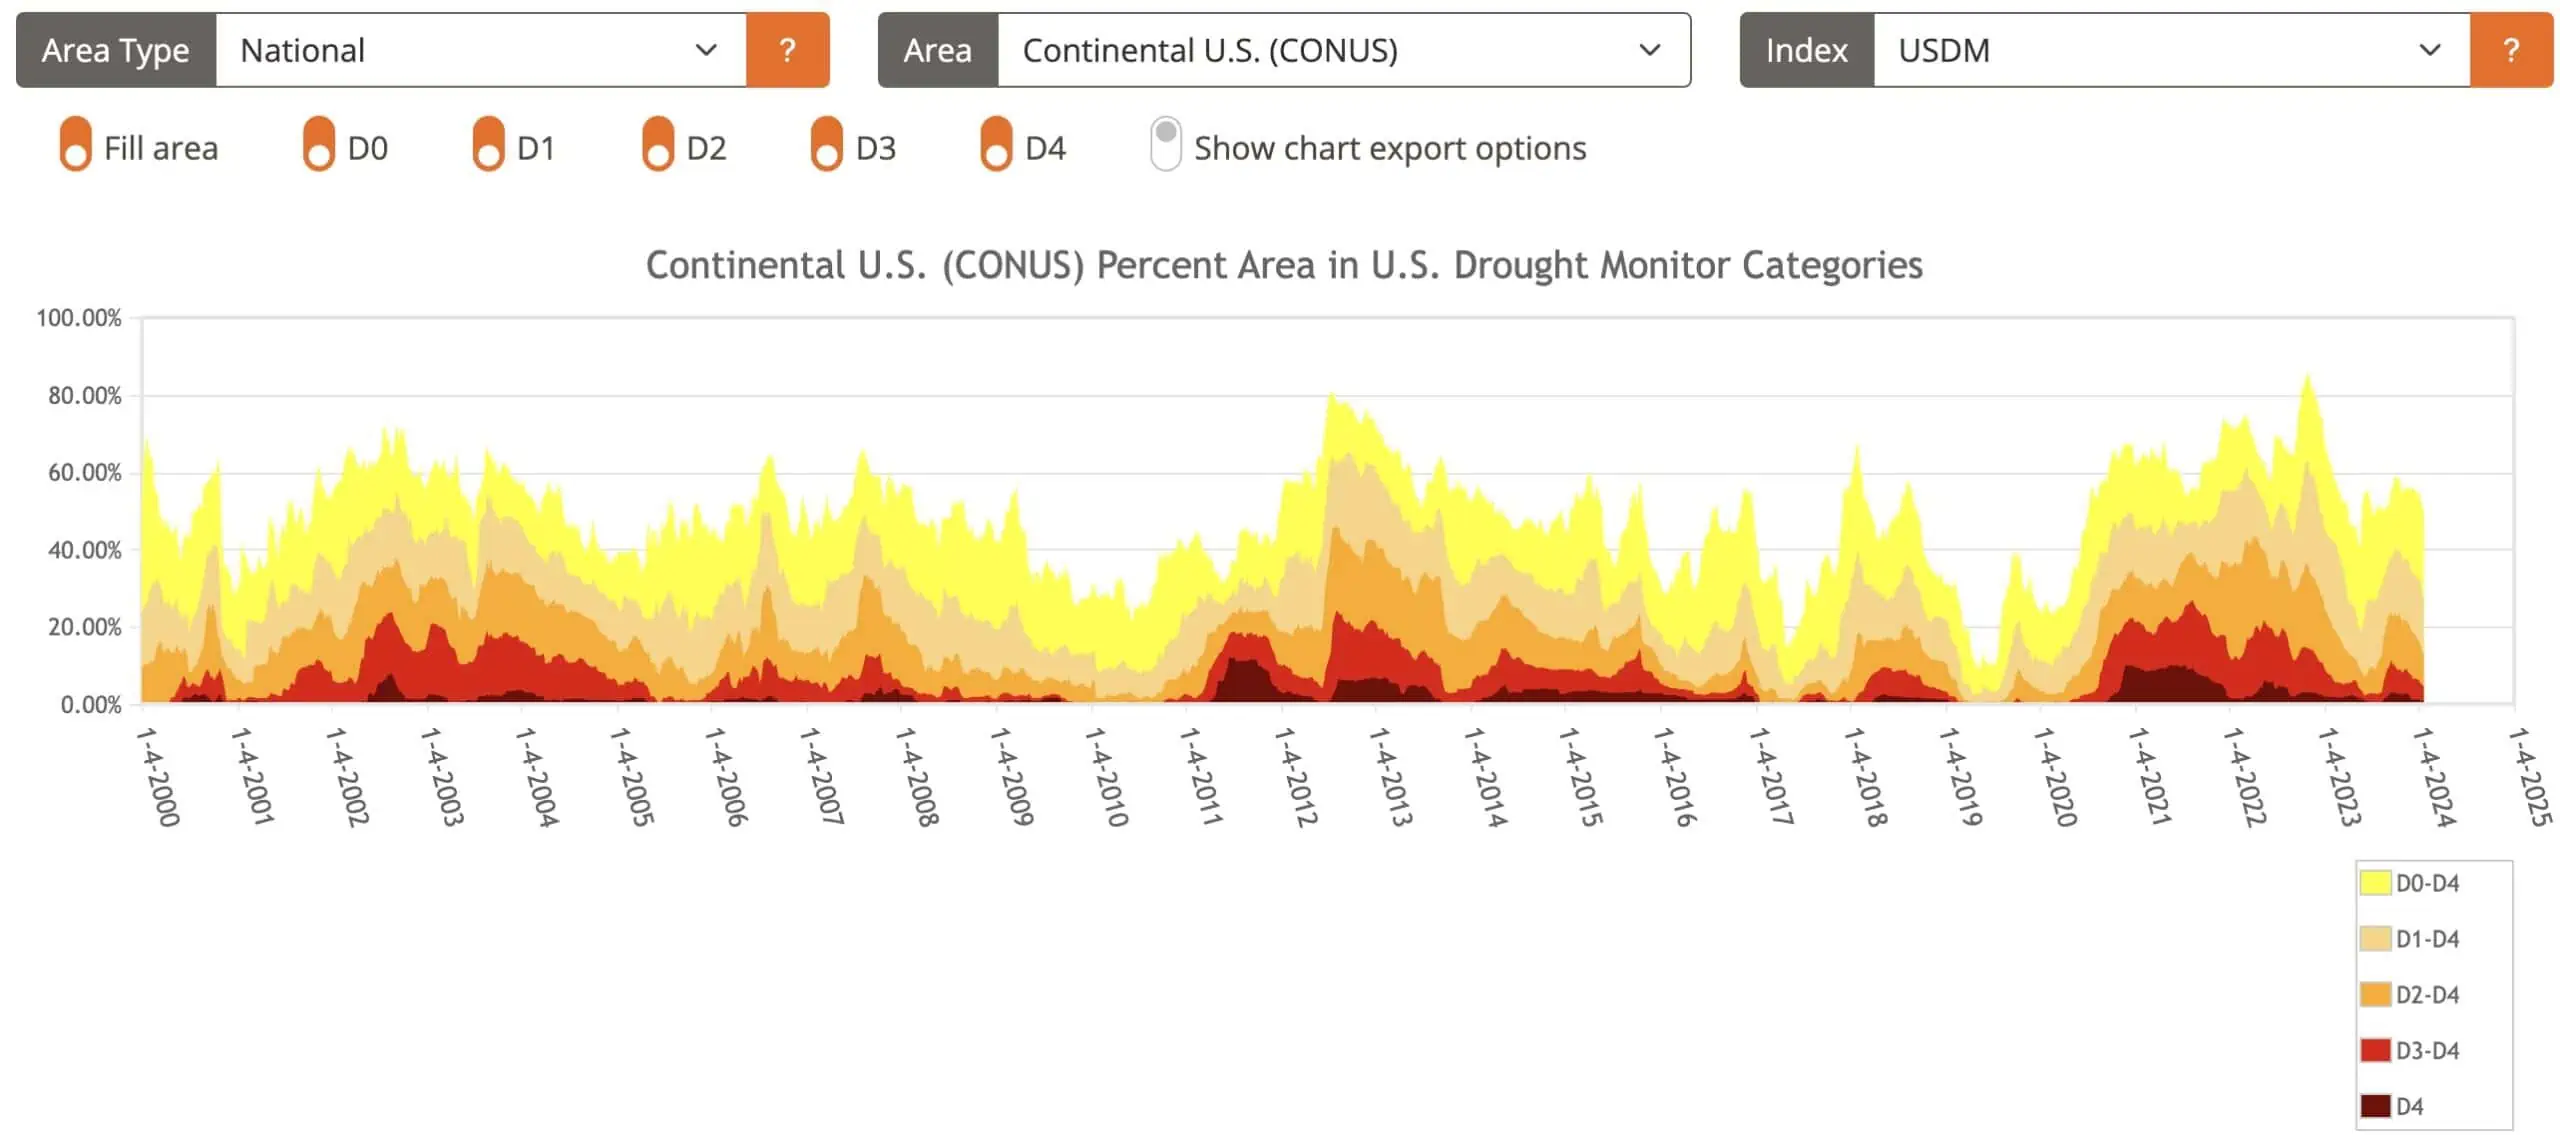
This is an incredible resource that can offer a very clear picture of which areas of the country have been historically affected by a lack of rainfall (something that can have a major impact on crop yield in any area).
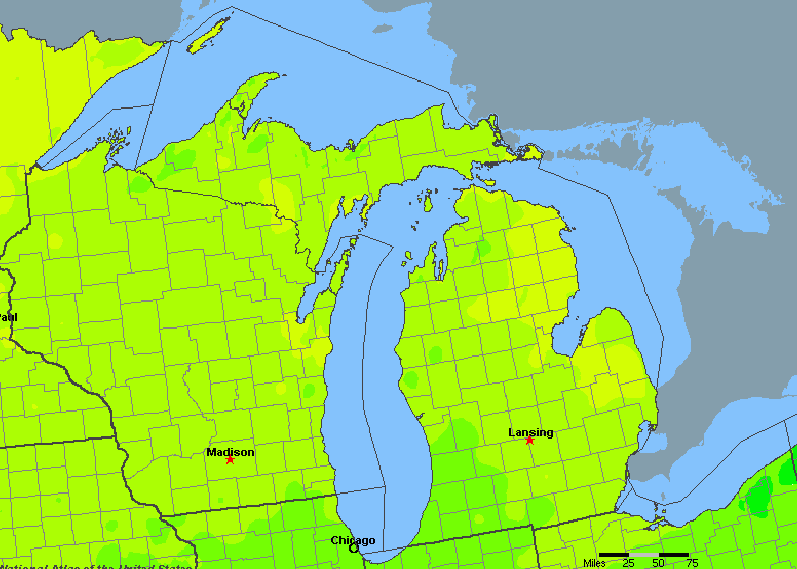
2. Annual Rainfall Map
El Dorado Weather offers a huge amount of information about the average annual rainfall across the U.S.
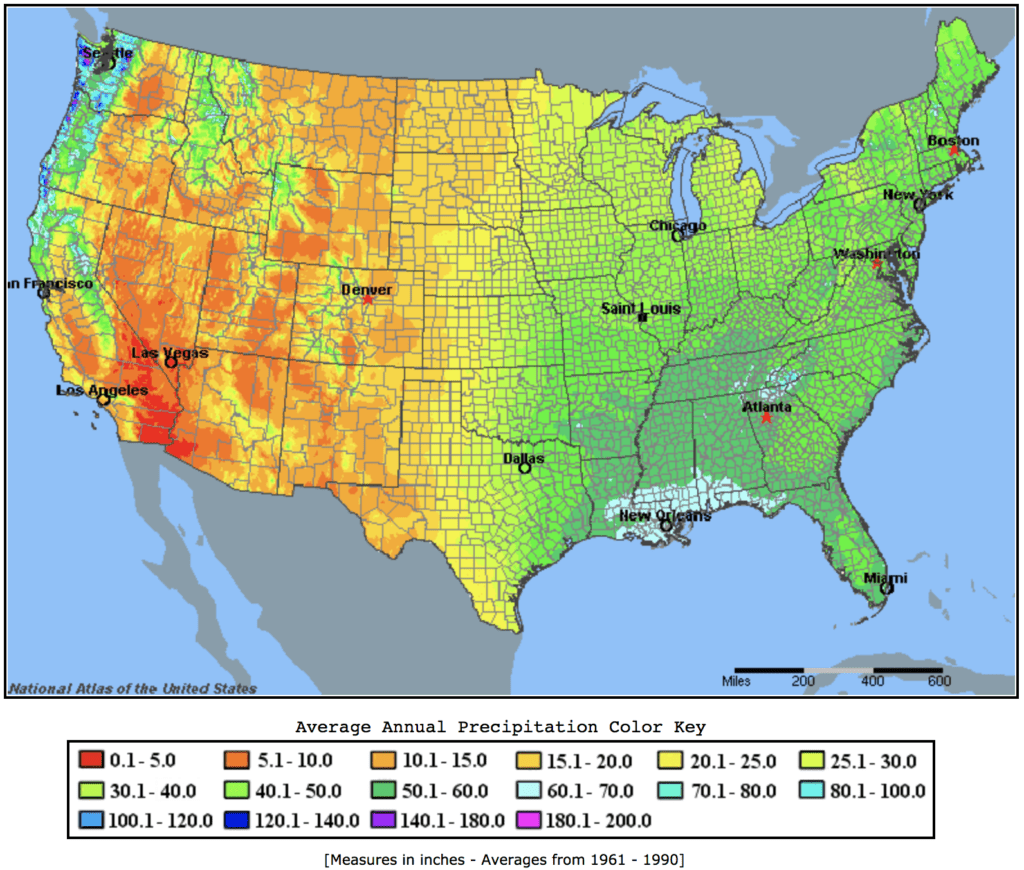 You can look at a full nationwide map or even drill down and look closer at each state and county… and it doesn't stop there.
 This website also can show a live feed of current temperatures around the country, averages around the country for precipitation, extreme weather, wind speed and direction, pressure, sky cover and visibility, frost, humidity, and a lot more (seriously… this is just the tip of the iceberg).
There are only a couple of drawbacks to this map:
- The data on these maps cover the annual averages from 1961 – 1990, so the information isn't exactly “current.” However, as long as global climate change doesn't kill us all in the next few decades, I think these maps adequately represent the climate in most of these areas today.
- These maps don't talk specifically about any extended periods of drought during the year (from what I could find, anyway) – only what the total rainfall is in any given area (and unfortunately, when you go for over a month without rainfall – even when the total annual rainfall may be relatively high, that's still enough to do serious damage to many crops). Luckily, though… we also have the Drought Monitor Map (see above). Between these two maps, you can get a pretty good idea of which areas get adequate annual rainfall AND don't experience many severe droughts throughout the year.
RELATED: The Beginner's Guide to Farmland Due Diligence
3. AcreValue Maps
AcreValue.com is a website widely used by farmland brokers, landowners, appraisers, and many other industry professionals to determine approximate values on a per-acre and per-county basis.
It currently maintains data throughout the entire United States except Hawaii and Alaska. Some data is free (like per-acre values and recent land sales figures), and some require a paid subscription (landowner mailing addresses, parcel searches by the owner, searching with advanced filters, and more).
At the very least, it can provide a decent starting point if you're trying to gauge approximately what farmland values are in a given area. However, just like valuing any piece of vacant land, getting a realistic figure requires a lot more research into the property's unique characteristics… looking at comparable sales is certainly helpful, but it can rarely give a conclusive valuation for a vacant land property (as much as we all wish it were that simple).
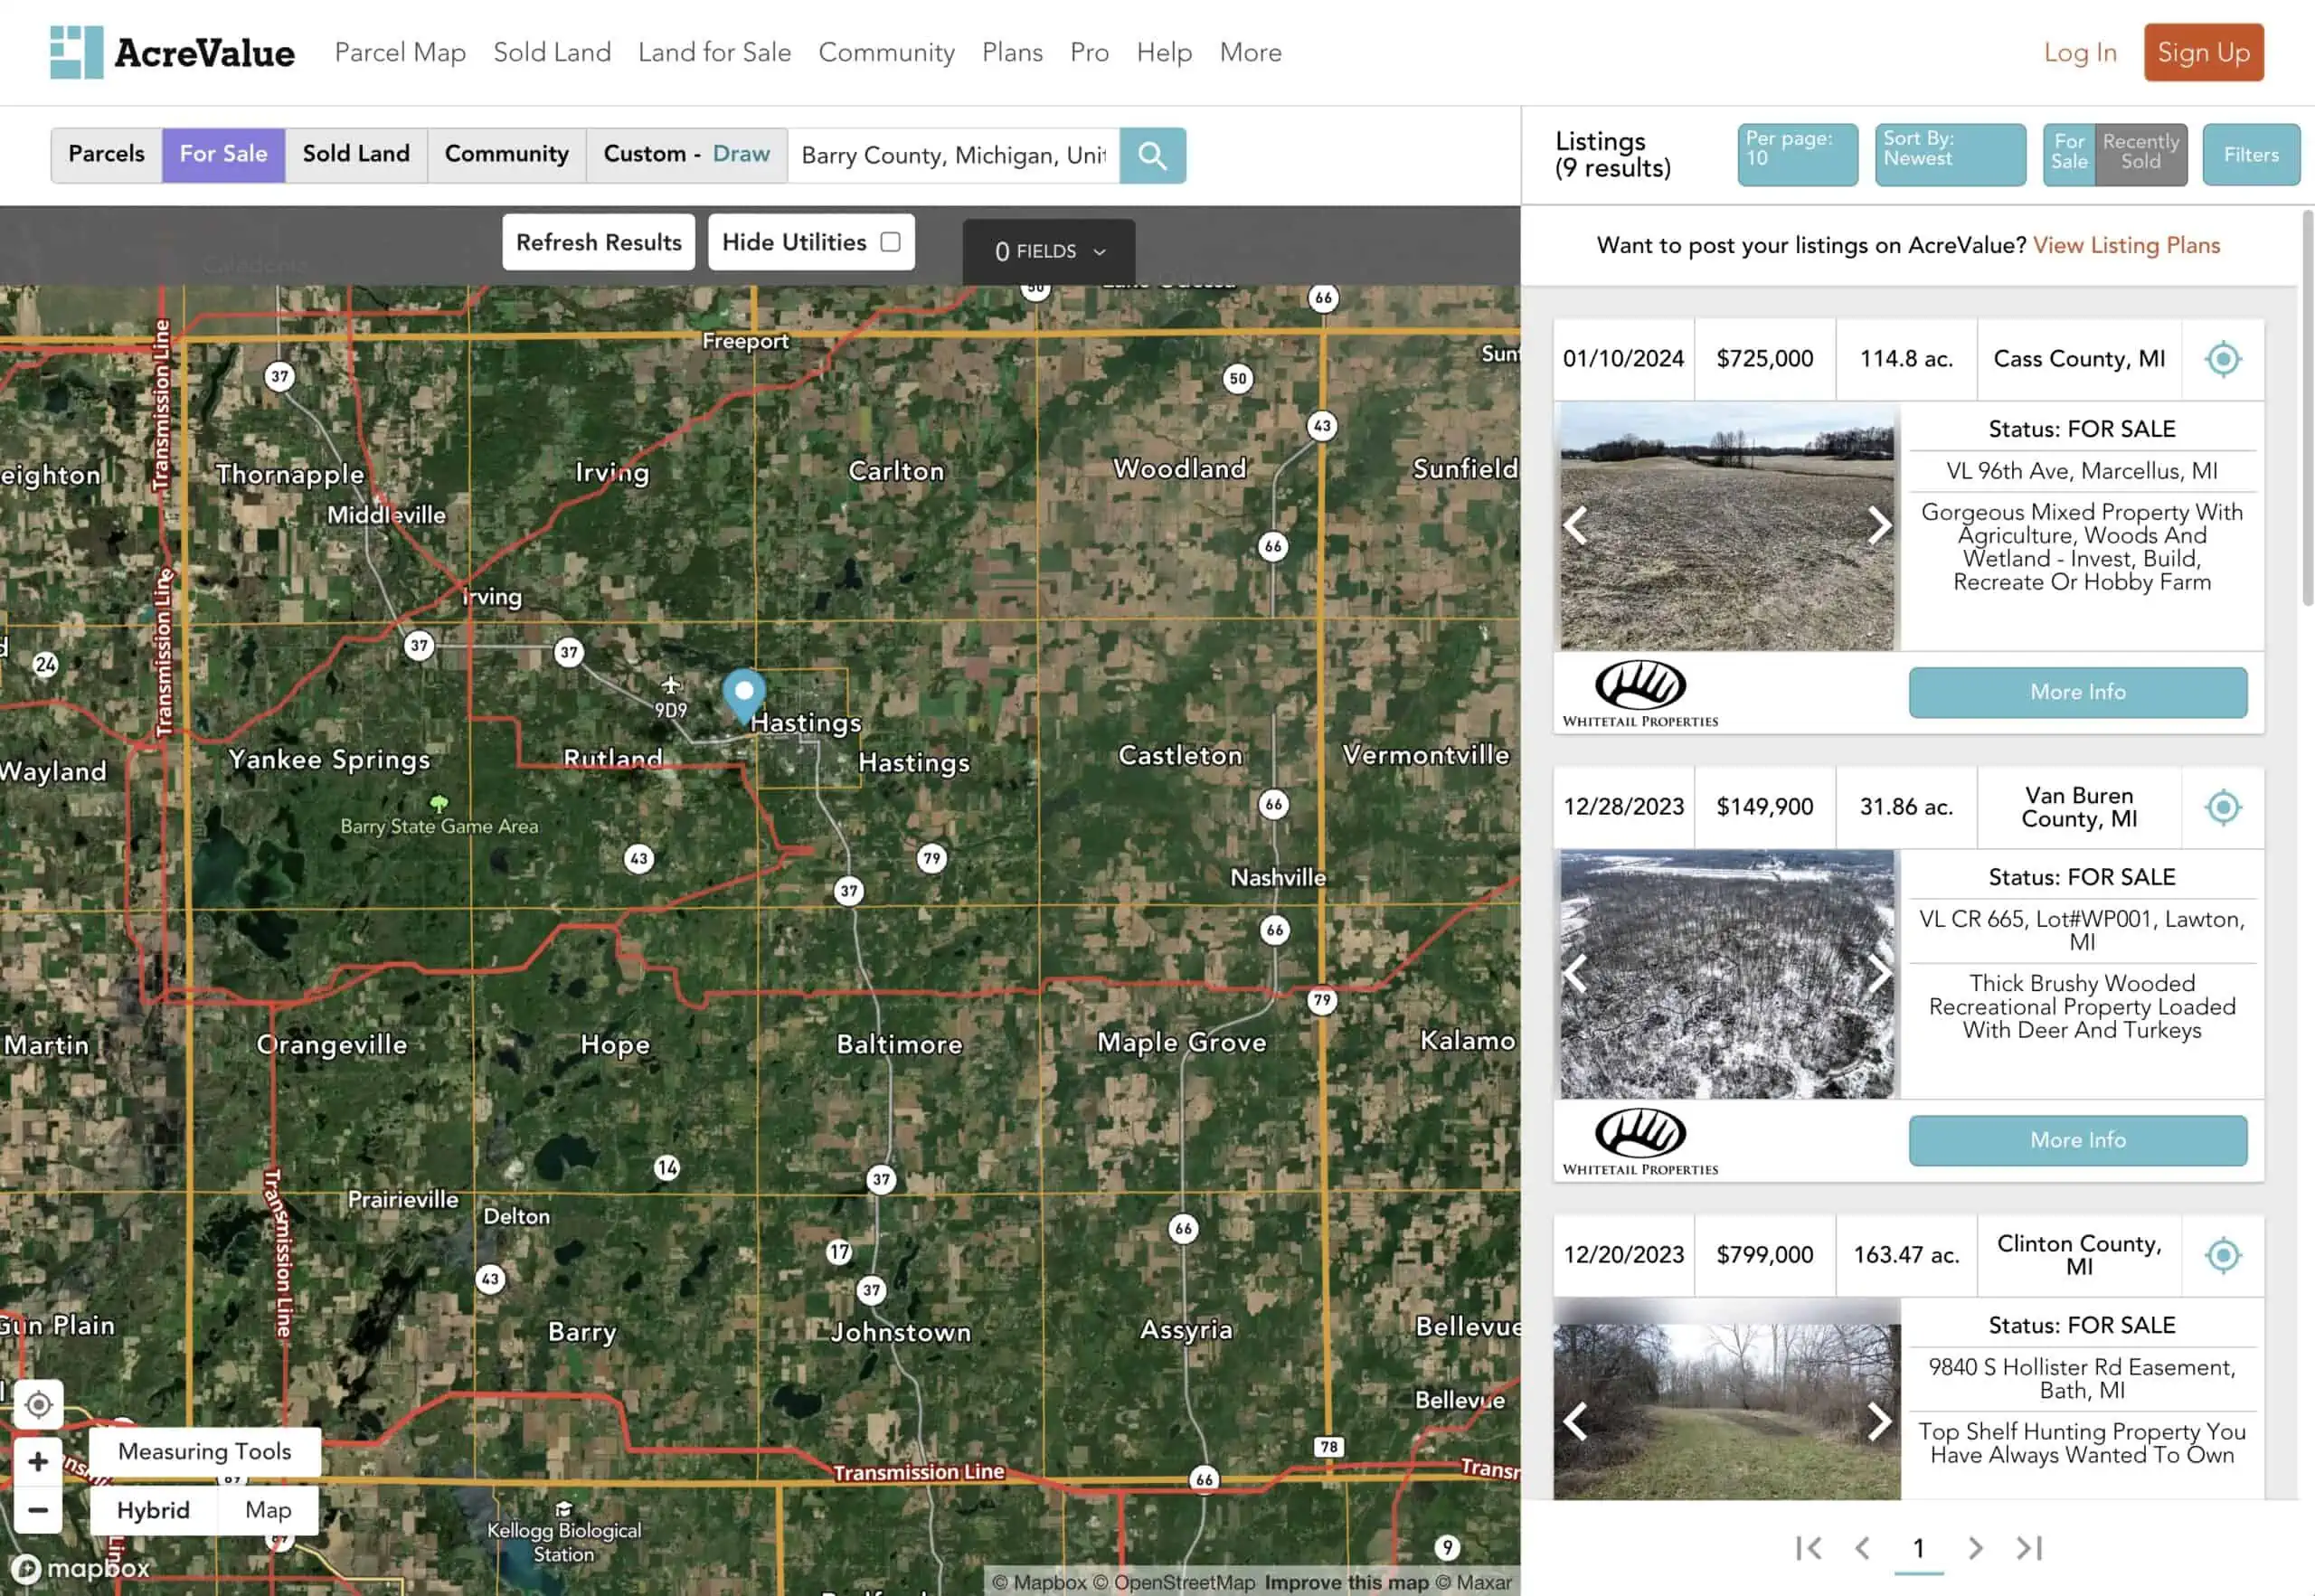
Nevertheless, as a “Step 1” in identifying a market where you want to invest, this can be a helpful tool in getting started.
4. Population Density Map
Every decade, the U.S. Census Bureau compiles data throughout the country detailing the population of each county (among many other things). You can see all the details in their data map viewer.
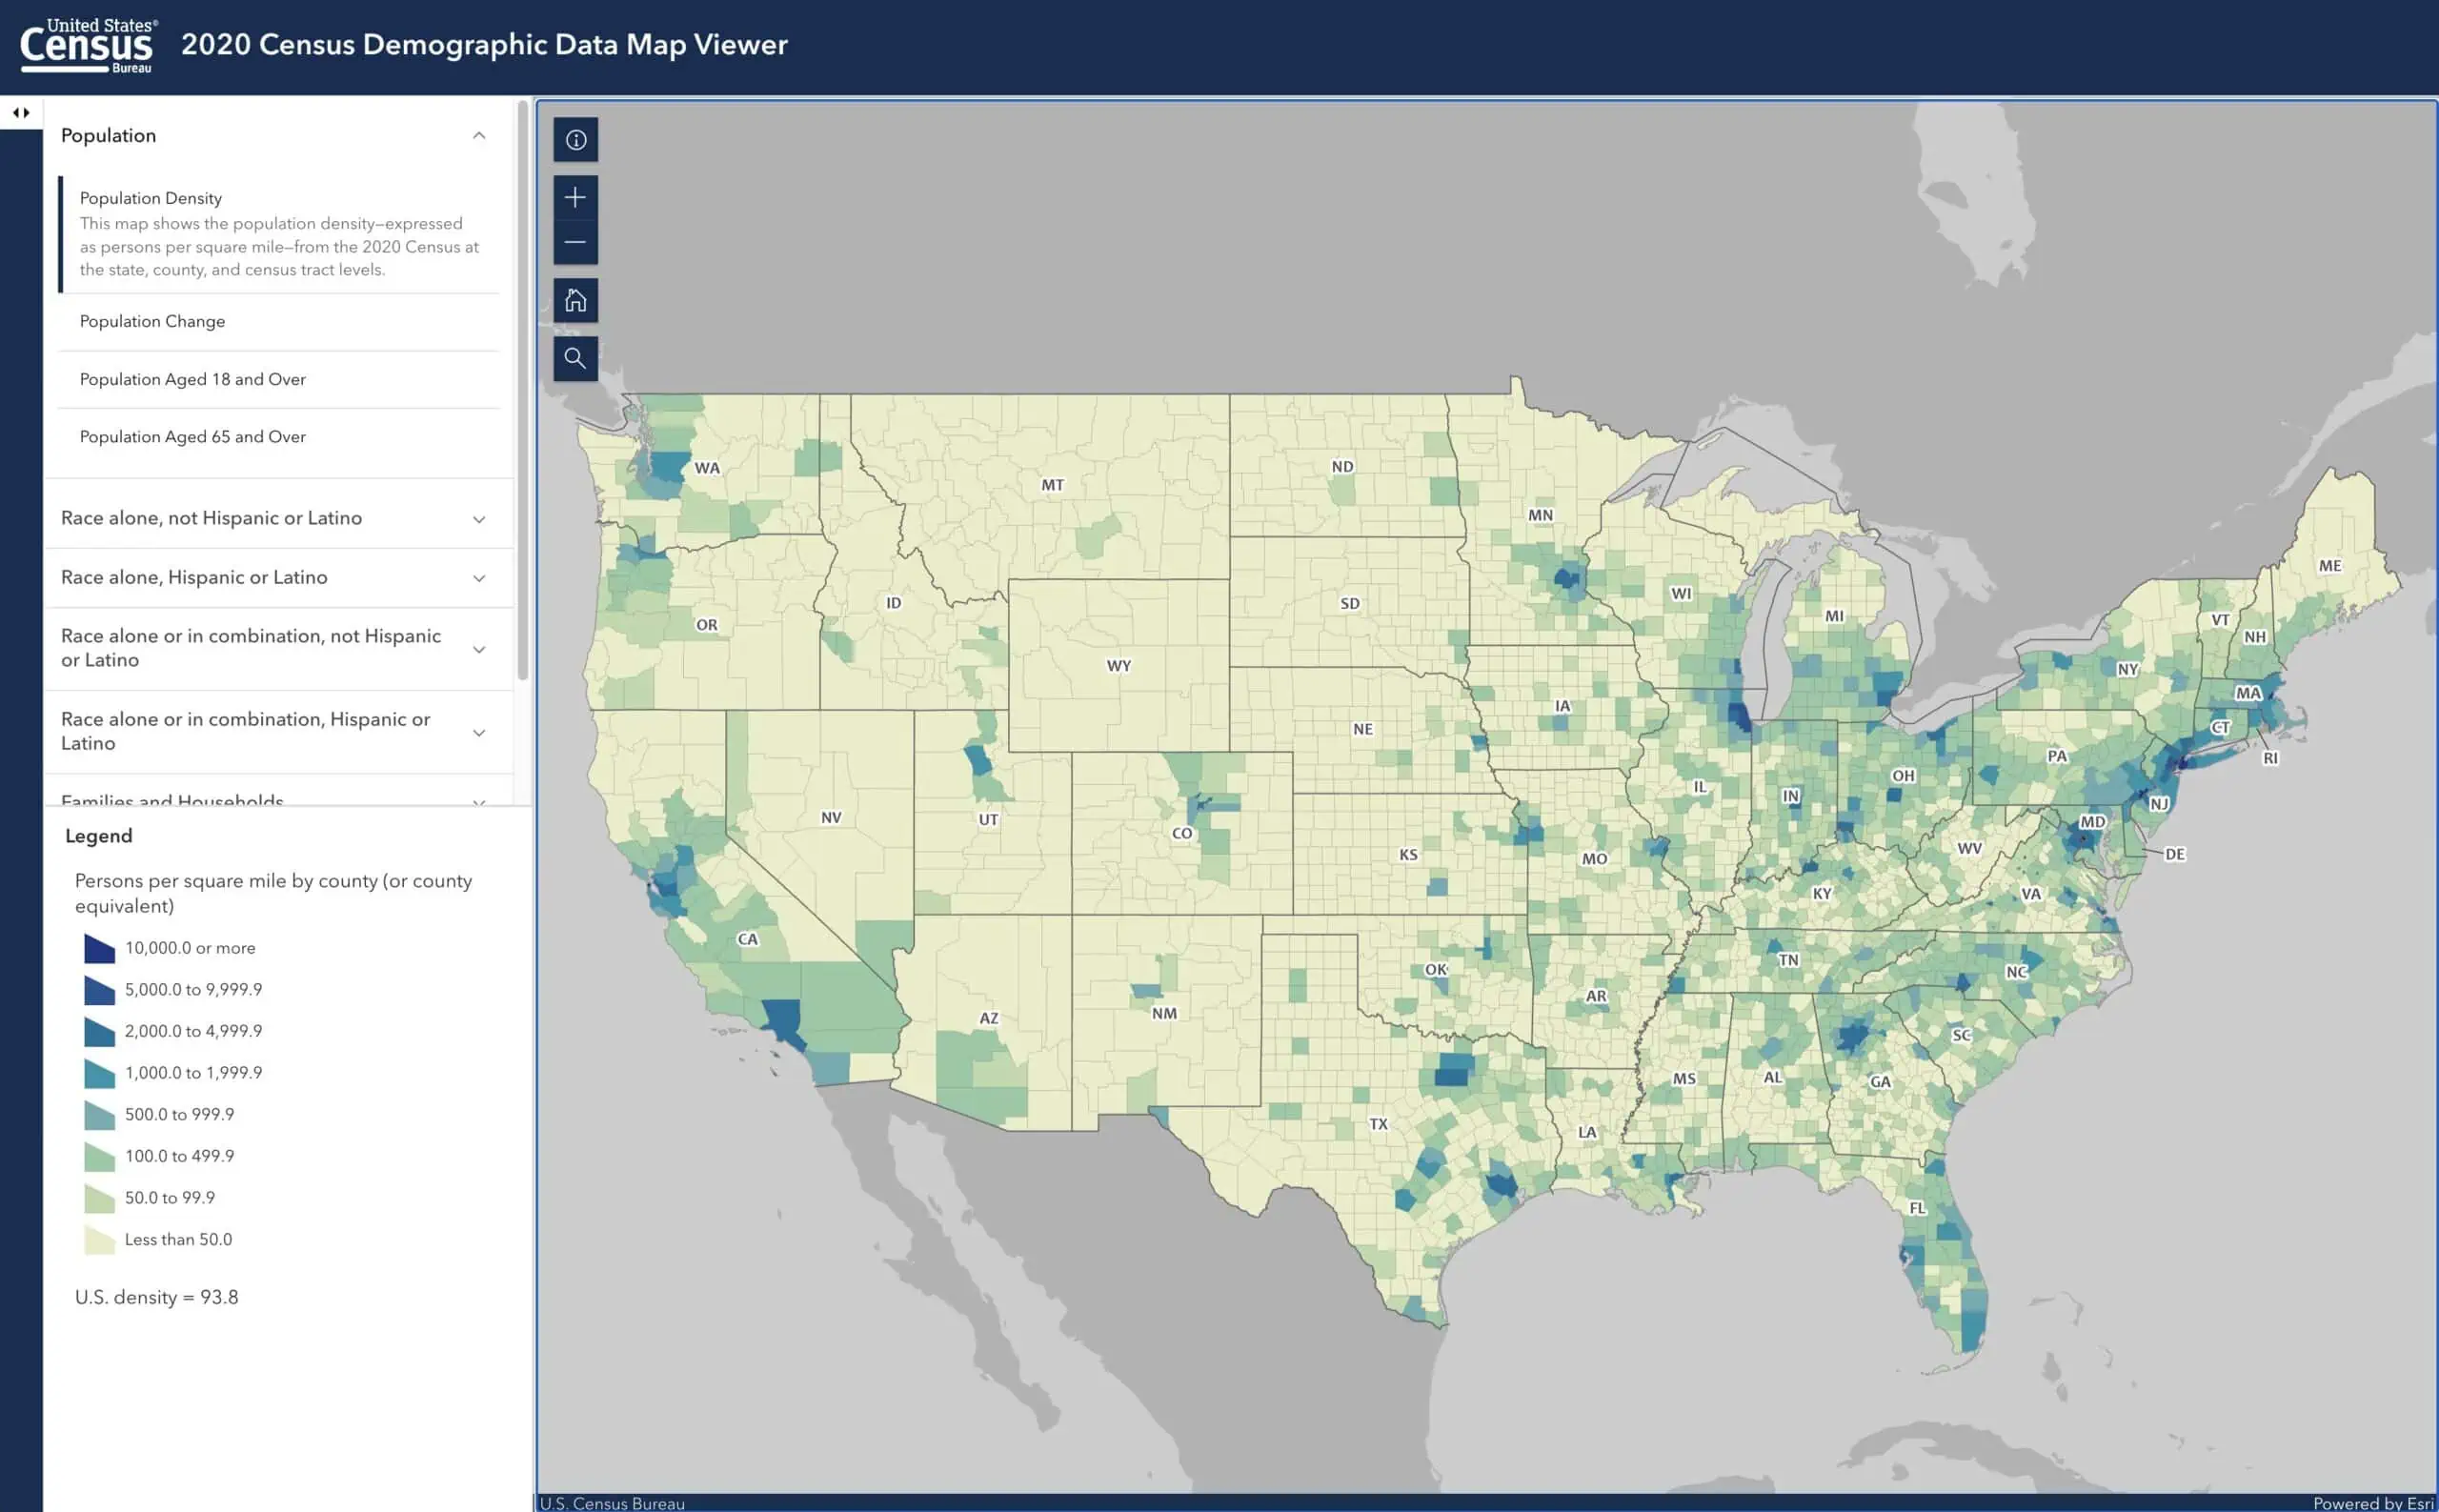
Why is this data important?
When farmland is located close to a larger population (as opposed to being situated hours from the nearest town), it inherently has a higher likelihood of being developed in the foreseeable future, which gives it a greater potential value through future appreciation.
RELATED: What is “Land Banking” and Why Should You Be Doing It?
Of course, there's nothing wrong with land in a more rural area. From a cash flow standpoint, high-quality, high-yielding farmland is just as valuable for leasing to a farmer, but if appreciation and/or repurposing the land away from farming is of any concern, this kind of information can be very useful to know about.
Along these same lines, you can also use this map from the U.S. Census Bureau to track the migration of people from county to county to see whether more people are moving to or away from the area where your land is located. Likewise, this map from Forbes will also give you a visual representation of where people are moving about any given county.
5. UNFAO Soils Map
The United Nations Food and Agriculture Organization maintains digital soil maps that cover most of the world. This is what their map of the United States looks like:
What does all this mean? This article from the USGS explains the map quite well,
The UNFAO soils map of the United States identifies approximately 315 soil units based on their physical and chemical composition, their topographic situation, and the local climate. The soil units were ranked using a soil fertility index known as the Fertility Capability Classification (FCC) system (Buol et al. 1974; Sanchez et al. 1982). This system provides a basis for comparing and rating soils worldwide for their suitability for agricultural use. The ranking system assesses the textural, structural, chemical, and climatic characteristics of the soil that have a direct relationship to fertilizer, plowing, and irrigation requirements for successful farming. by their number of agronomic limiting factors. Soils with a high number of limiting factors are problematic and require remediation for agricultural production. The best soils for agriculture have no or few limiting factors.
For our analysis, we ranked soil units in the United States as ranging from those having zero or no limiting factors to those with eight limiting factors. Soils with no limiting factors are the best soils for agriculture (in terms of least cost of production), and soils with seven or eight limiting factors were considered nearly impossible to cultivate because of the presence of a cumulative number of impediments (dry, saline conditions, shallow soils, high slope, etc.). Looking at the soils data for North America, it must be said that the United States contains a lot of good soils within its borders. About 53% of the total soil area of the United States is made up of soils with two or fewer limiting factors, and over 90% of the country is composed of soils with four or fewer limiting factors. While some limiting factors are more economically significant than others, the United States is still capable of impressive agricultural production relative to the rest of the world.
This is one of the more important maps in this list because it covers the suitability of the soil for growing crops. Growing anything in soil that doesn't do well in fostering plant life is a very difficult problem to overcome. As this map indicates, some very clear areas of the country are well-suited for farmland investing, and some aren't.
If you aren't sure which region to start your search for farmland, this map can be helpful at pointing you in the right direction.
6. State Income Tax Map
Regardless of what state you own and buy land in, one important consideration is what state income taxes you'll have to pay. This map of the U.S. from TaxFoundation.org lays out the state income tax rate in every state as of 2023.
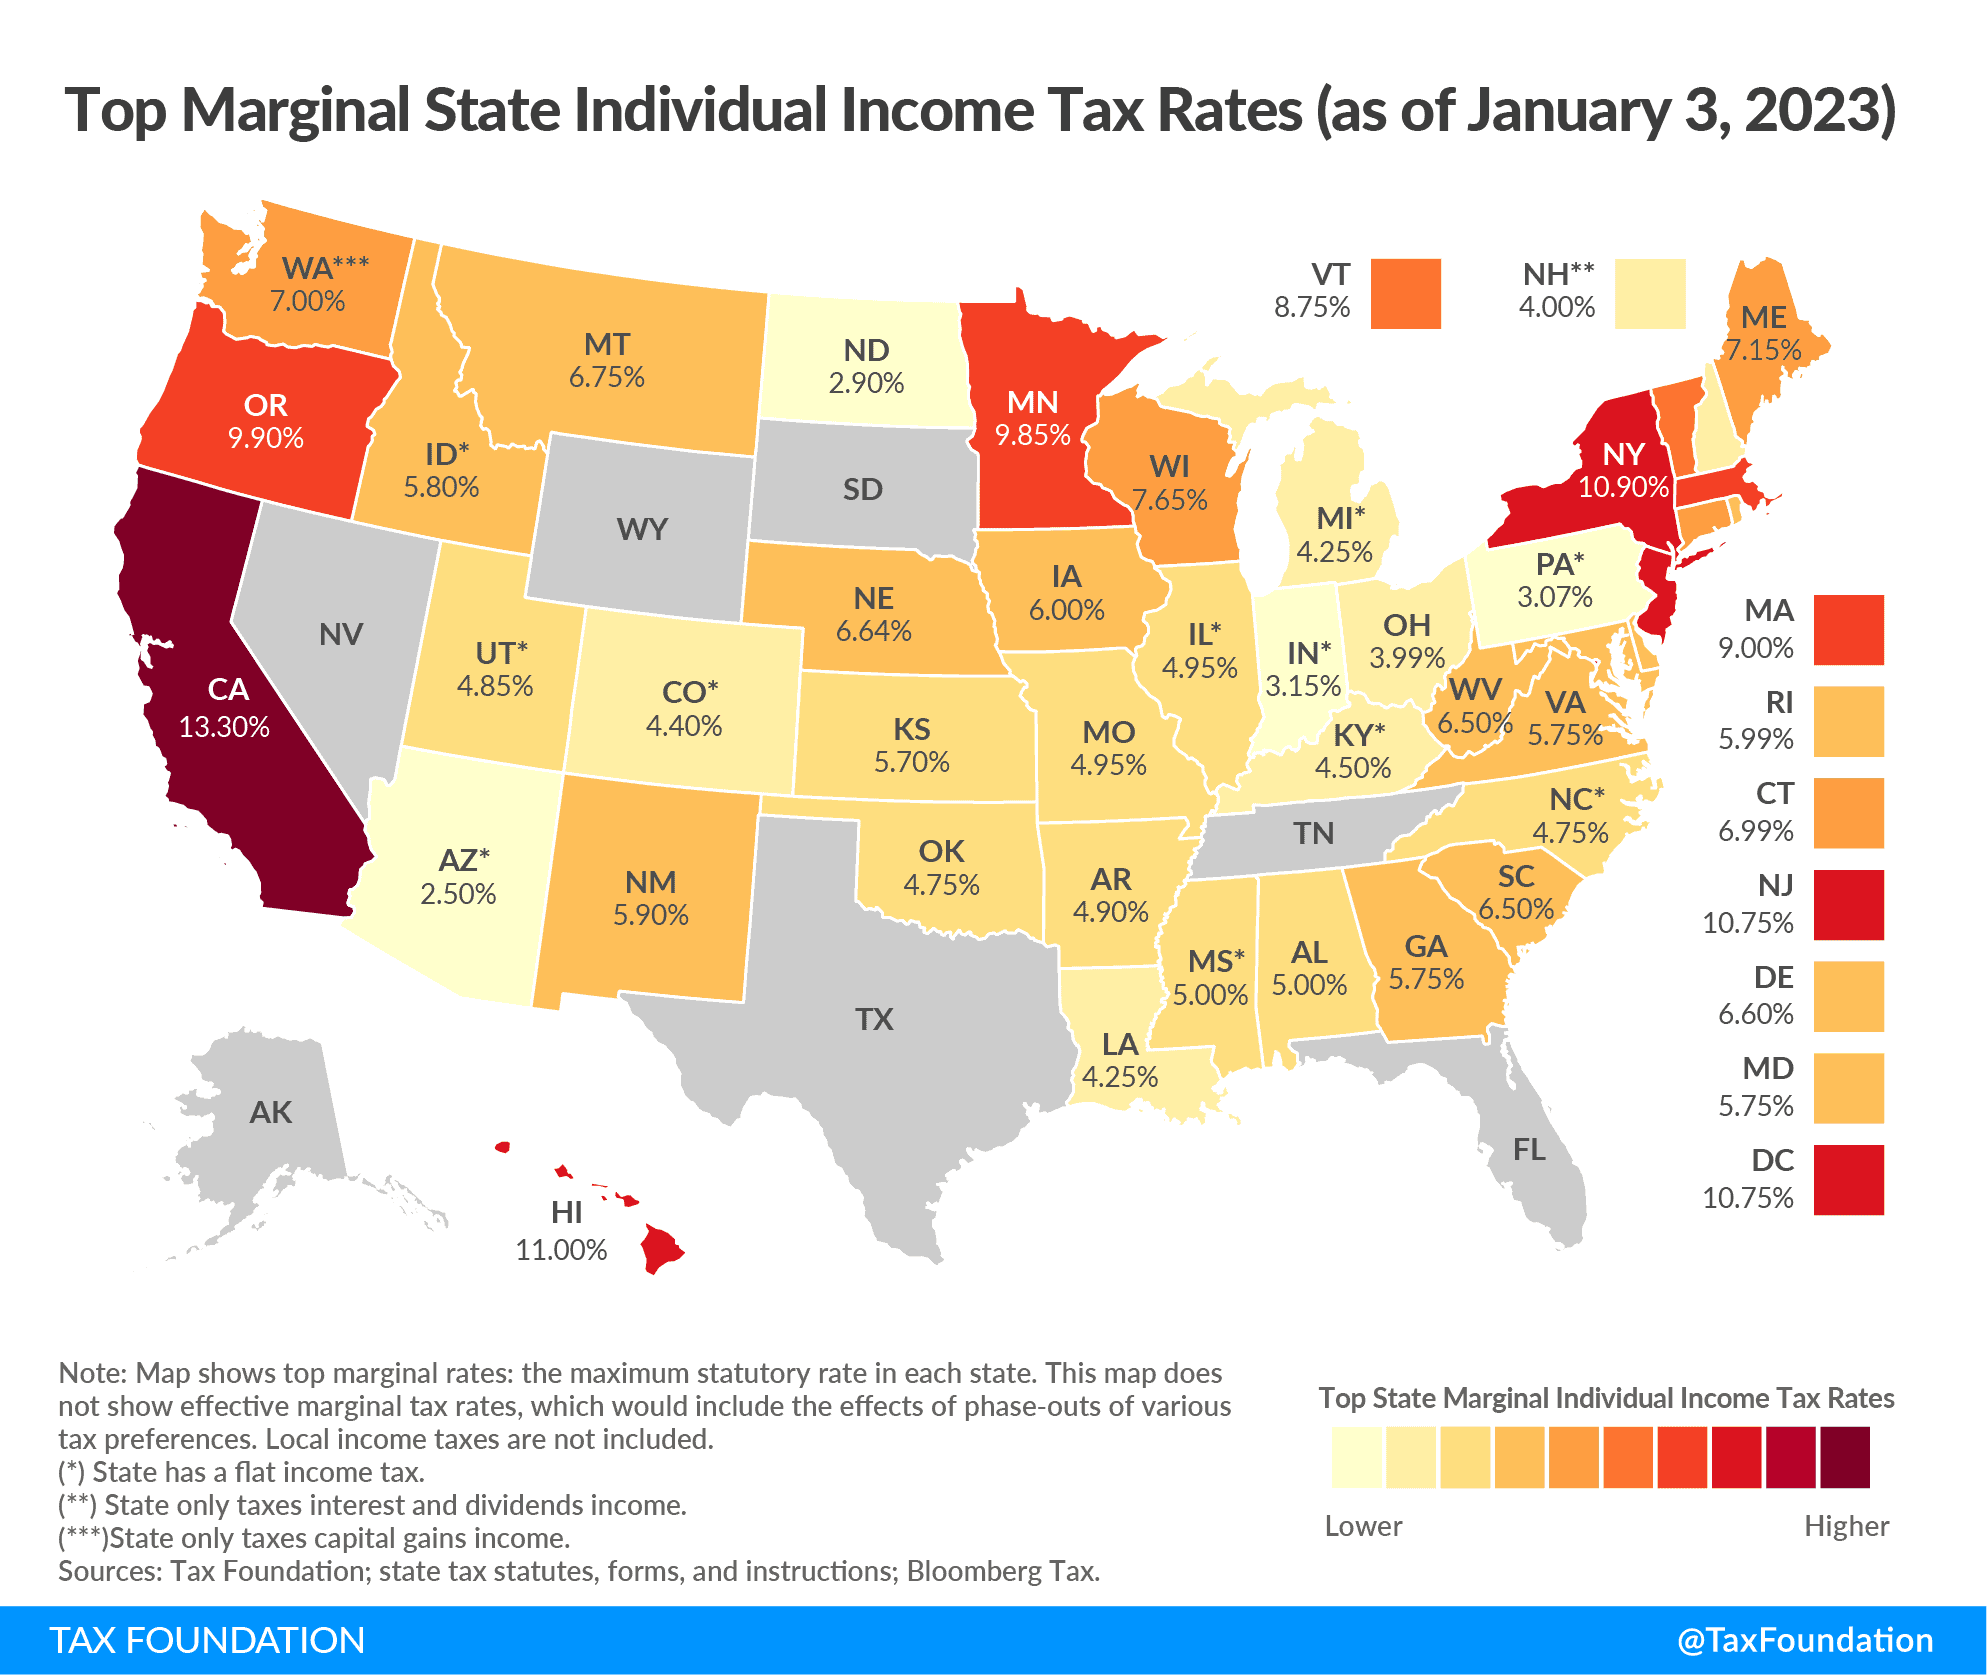
As you can see, some states will take a much larger portion of your annual revenue than others, so wherever you decide to invest, you'll want to understand the repercussions of what this will cost you.
Also note – this is a map that has the potential to change every single year, so depending on when you're reading this, you'll want to make sure you're working with current and accurate information.
7. American Farmland Trust Maps
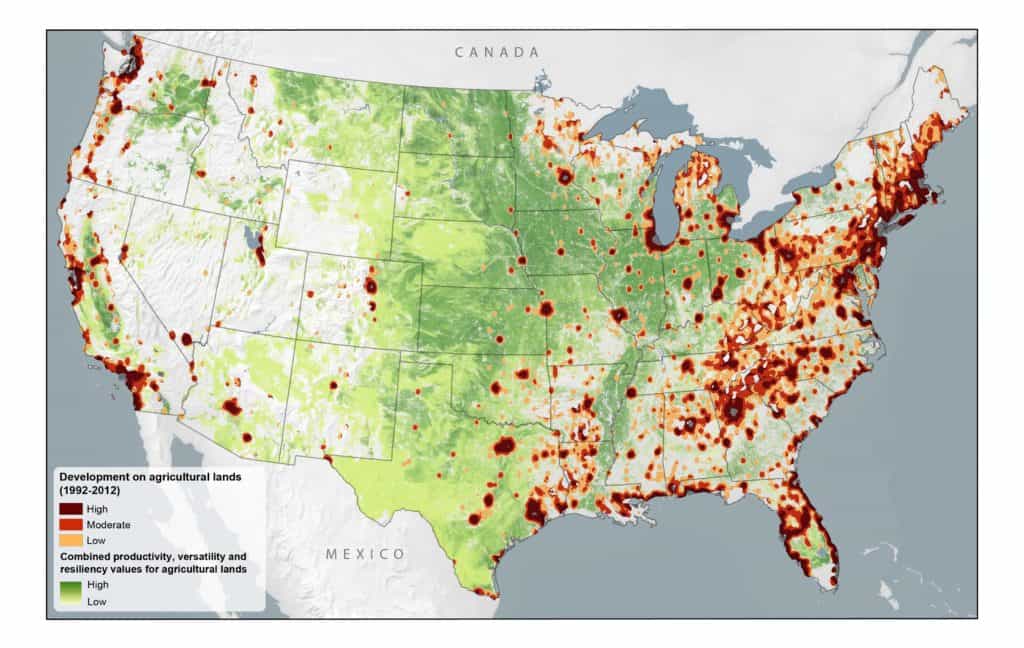
The American Farmland Trust has an extensive report called Farms Under Threat that details the extent of farmland loss within the U.S. As part of this report, several maps can shed light on which areas of the country have the most farming activity and how this landscape has changed over the past few decades.
For example, this map shows which areas of the country have seen the greatest development in the highly productive agricultural areas (i.e., these are the urban areas that have expanded outward to consume and repurpose productive farmland):
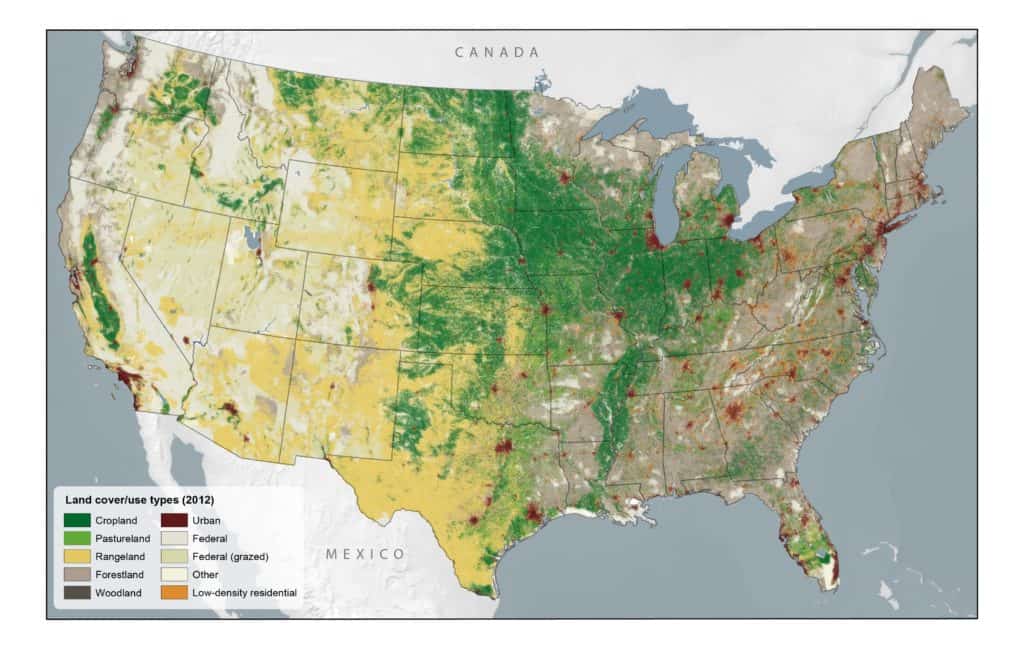
Another map shows which areas of the country are broken up into cropland, pastureland, rangeland, forestland, and woodland (among other things). Depending on which type of farmland you're looking for (e.g., growing crops, livestock grazing, harvesting timber, etc.), this map can point you to the areas where those types are most prevalent.
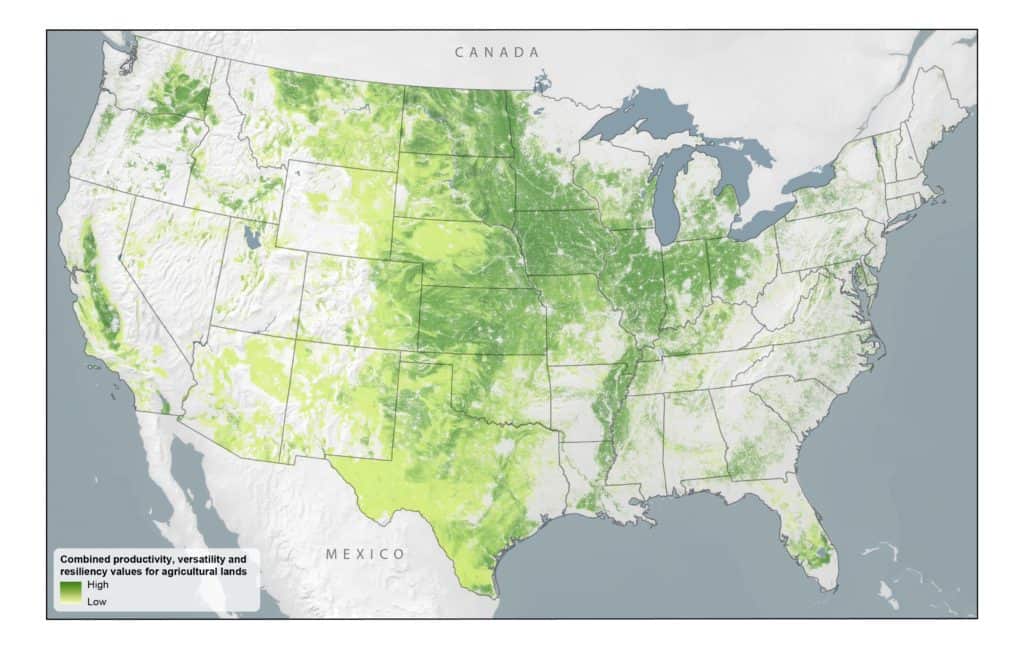
This next map shows the combined productivity, versatility, and resiliency of agricultural land, based on the “quality of the soils, the farming infrastructure that exists, and climatic conditions, such as the length of the growing season”. (Source)
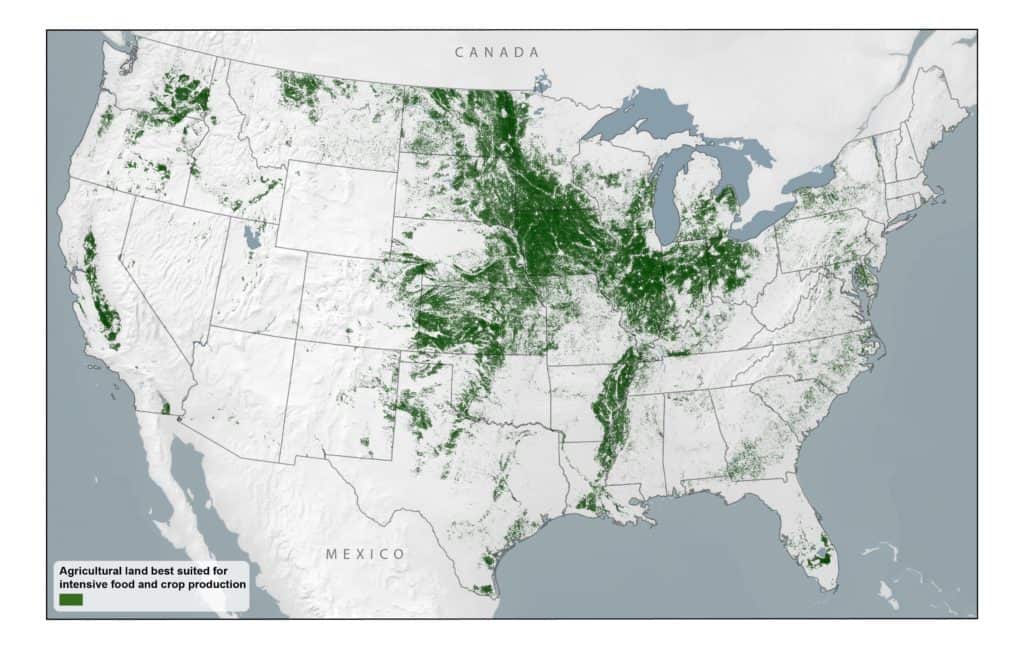
This next map shows a 2012 snapshot of U.S. farmland best suited for intensive food and crop production. As is explained in the original report, food and crop production include:
“Fruit and nut trees, vegetables, staple foods, grains, and animal feed with the fewest environmental limitations. This land represented about 36 percent of U.S. agricultural land, or only 16.7 percent of the total land area in the continental United States in 2012.”
Keep in mind that these maps are just the tip of the iceberg. To see many more maps and other supplemental information, check out the full report on the American Farmland Trust website. You can also use their interactive map to see the data for yourself.
Putting It All Together
In some markets, land is ideal for farming, but from an ROI perspective, that doesn't necessarily make it the best place to invest your money.
For example, farmland in Iowa has great soil and climate conditions, but it's also a state with a fairly high income tax rate and a very competitive market with some of the most expensive farmland in the world.
Similarly, Texas may have areas with high-quality soil, a healthy and growing population, and no state income taxes to speak of, but the state also suffers from drought, which can take a heavy toll on yield rates and, ultimately, earn less revenue per acre for the landowner.
Deciding where to invest is never as simple as drawing one obvious conclusion from the data. Ultimately, you need to evaluate the specifics of the deal you're looking at and assess the risks of the package.