REtipster features products and services we find useful. If you buy something through the links below, we may receive a referral fee, which helps support our work. Learn more.

In this blog post, I will give you the low down on what I found while working with the platform.
The Problem
Whether you're working in a real estate market that is very hot (with high prices and low vacancy rates) OR in an economic slump (with low prices and high vacancy rates) – it's important to understand a few key things:
- Which properties can be bought at a low price while generating great cash flow.
- Where to find reliably accurate numbers for a property's projected income and expenses.
- What the vacancy and occupancy rates are in a given neighborhood?
Of course, getting this information on your own is feasible.
For all of the rental properties I've purchased to date, I did all this research manually. It consumed a CRAZY amount of time, analyzing dozens of properties and verifying the numbers on each one.
Unfortunately, most of this time was pretty much wasted. Even though all the analysis gave me a great education on the market I was working in, most of the properties I analyzed didn't result in closed deals – it just told me which “opportunities” weren't going to work.
In the same way, I have to send out twenty low offers to get one acceptance – it takes a lot of fruitless effort to find that one killer deal on a rental property. Even though it's definitely worth all the effort in the end, wouldn't it be great if there was a way to find more deals and waste less time?
Enter Mashvisor

The real strength of Mashvisor is that it saves time (A LOT of time) when looking for and analyzing properties. The website pulls in data from several sources (including different MLS sources, Auction.com, Airbnb, HomeAway, companies like Zillow, Redfin Walk Score, Realtor.com, public record sources, and others), and organizes it in a way that makes it fast and easy to crunch the numbers on a lot of properties very quickly.
It's a great tool to assist in valuations, finding some fairly reliable rent figures in your area (think Rentometer but with more data and sophistication), and even finding some reasonably accurate expenses for each property.
Want to give Mashvisor a try? Sign up through our affiliate link and use promo code RETIP25. You'll get a 25% discount on your first payment and help support REtipster.com!
Potential Uses
From what I saw, Mashvisor has a few different uses that are interconnected, but depending on what each investor needs help with, some of its functions may be more useful than others.
Search Page
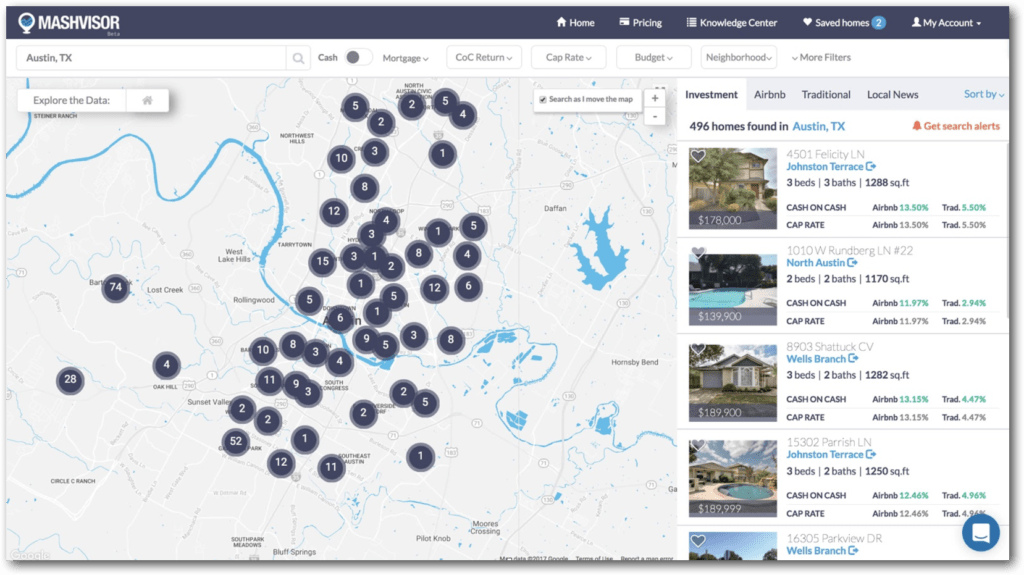
In my opinion, the most useful and unique part of the site is its search functionality.
It has a similar look and feel to websites like Zillow and Redfin, but it offers filtering criteria designed intentionally for real estate investors.
You can start by selecting the location (city, neighborhood, address, or zip code) where you're thinking of investing in real estate.
It will show you all of the publicly listed properties on the MLS, foreclosures, bank-owned homes, and short sales listed on Auction.com. At the same time, it will run the numbers on everything and show you a few important figures for each property that most investors will be interested in:
- The current listing price
- The address (the locations are also shown on the map)
- The Cash on Cash Return, if used as a Traditional Rental
- The Cap Rate, if used as a Traditional Rental
- The Cash on Cash Return, if used as an Airbnb Rental
- The Cap Rate, if used as an Airbnb Rental
What I think is particularly useful is that you can sort all the properties based on the Cash on Cash Return, the Cap Rate or the asking price (among other things).
In other words, if you just want to cut through all the junk and see which properties have the highest potential return based on these projected numbers, it will weed out all the properties you probably won't care about.
Heatmap
The most prominent feature of the Search Page is the map on the left, which shows you how many properties are available for sale in each of the neighborhoods of your selected city. You can easily turn this map into a heatmap by selecting one of the rental comps, which include:
- Listing Price
- Airbnb Cash on Cash Return
- Traditional Cash on Cash Return
- Airbnb Rental Income
- Traditional Rental Income
- Airbnb Occupancy Rate
Want to give Mashvisor a try? Sign up through our affiliate link and use promo code RETIP25. You'll get a 25% discount on your first payment and help support REtipster.com!
The simple color scheme of the heatmap allows you to select and focus on the neighborhoods that match your search criteria the most (just remember that “red” means “low”, and “green” means “high”).
Most real estate investors, for obvious reasons, would be interested in “red” property price and “green” cash on cash return, rental income, and occupancy rate. This is where you will pay the least and make big money.
Available Properties
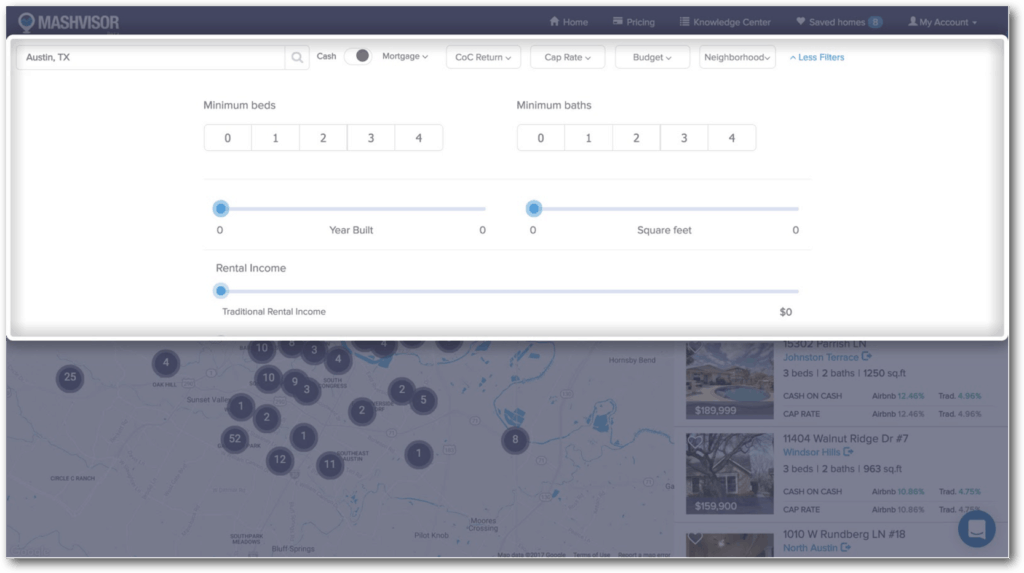
While you're using the heatmap, in the right-hand side of the Property Page, you will still see a list of all properties available in your selected city, which you can filter and sort by several metrics:
- Cash vs. Mortgage
- CoC Return (Traditional and Airbnb)
- Cap Rate (Traditional and Airbnb)
- Budget
- Neighborhood
- Number of Bedrooms
- Number of Bathrooms
- Year Built
- Square Feet
- Rental Income (Traditional and Airbnb)
This feature is particularly interactive because every little change you make to the filters results in a recalculation of all the metrics for the available properties.
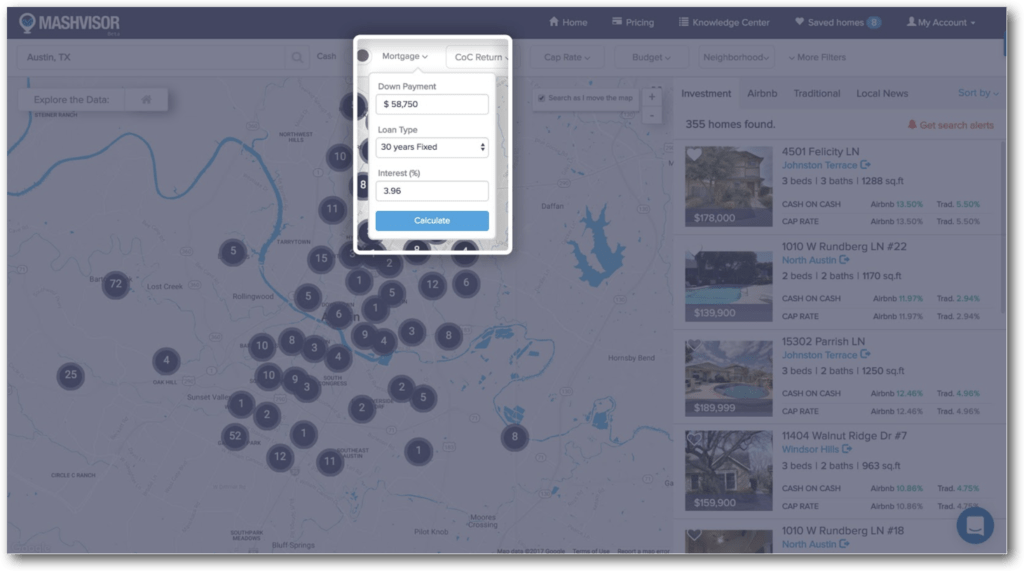
For example, if you switch from cash to mortgage payment and set your down payment, loan type, and interest rate and then hit “Calculate”, the Airbnb and Traditional CoC Return for all available properties will change.
The available filters allow you to customize your property search to every little detail that matters to you as a real estate investor.
For instance, you can search for properties that fit this kind of criteria:
- Have 2 bedrooms and 2 bathrooms;
- Were built after 1970;
- Are between 1,500 and 2,500 square feet;
- Are a Single-Family Home;
- Are currently For Sale;
- Have a CoC Return of above 8% when you use a 30-year fixed mortgage;
- Fits within your budget of $350,000.
Property Analytics Page
Once you’ve found a few properties that match your search criteria, you can click on any of them to get more detailed information about each one. At the top of the page, you will see a few things to summarize what you're looking at :
- Property Type: Single-Family, Condo/Coop, Townhouse, Multi-Family, etc.
- Address
- Property Price
- Square Feet
- Number of Bedrooms
- Number of Bathrooms
Below you will find a detailed description of the property and a simple contact form to contact real estate agents working in the area.
Rental Strategy
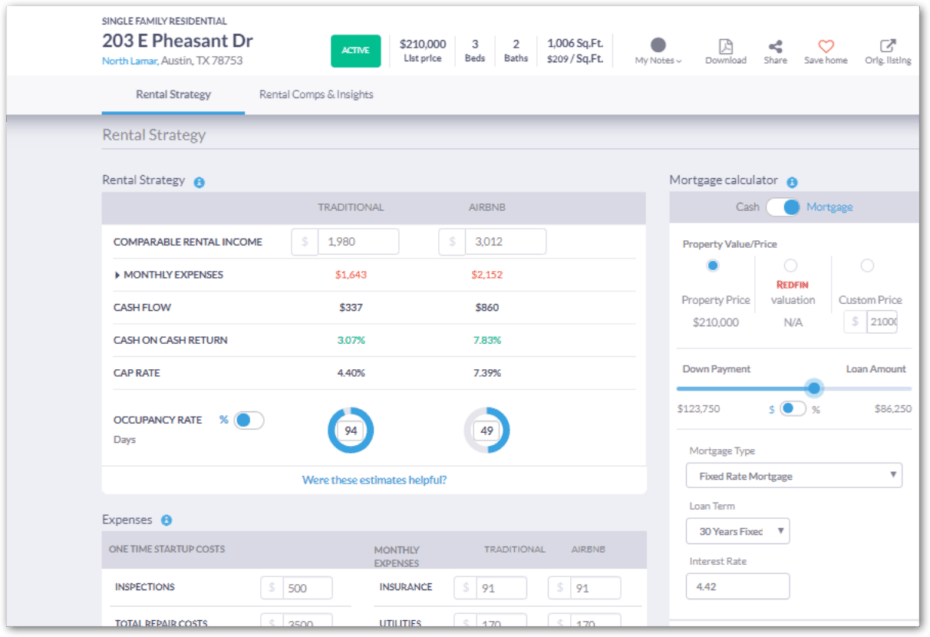
The Rental Strategy tab is where you will find some of the most useful information to analyze a particular real estate property to determine its value and its viability as an investment property.
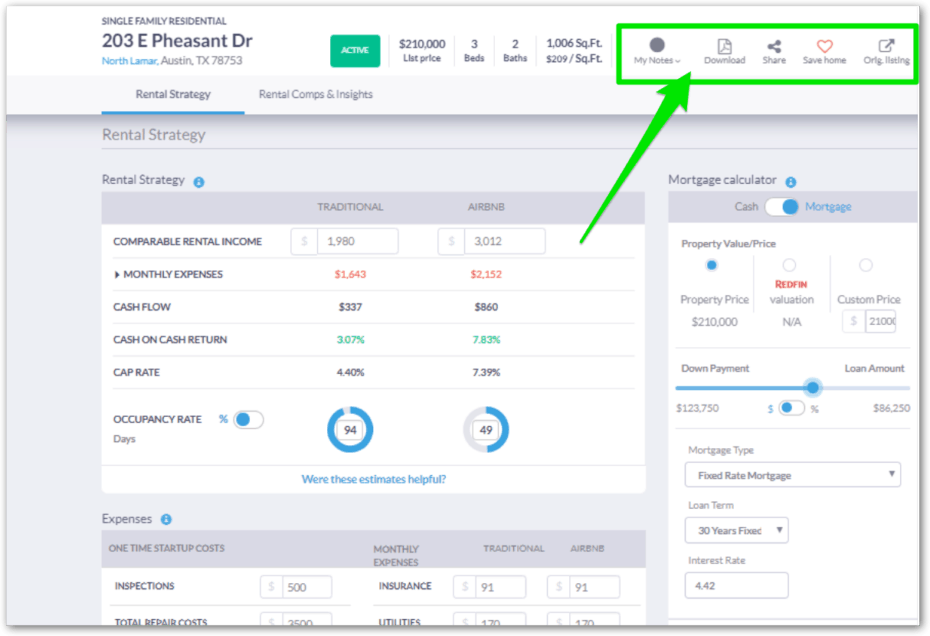
In the upper right-hand corner, you can use the buttons to:
- Leave notes on the property for yourself
- Download the property report
- Share the property report via email
- Save the property
- See the original listing
Traditional Rental vs. Airbnb Strategy
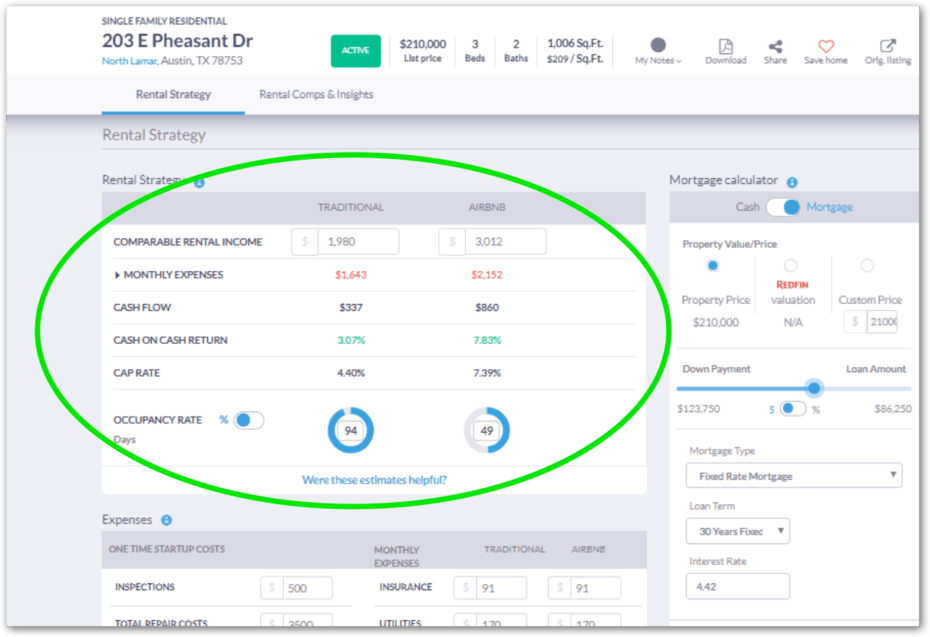
As you scroll down the Rental Strategy tab, you can see the optimal rental strategy for the property you're evaluating: traditional (long-term rental) or Airbnb (short-term rental). You can compare the forecast outcomes of the two rental strategies in terms of:
- Comparable Rental Income
- Monthly Expenses
- Cash Flow
- Cash on Cash Return
- Cap Rate
- Occupancy Rate
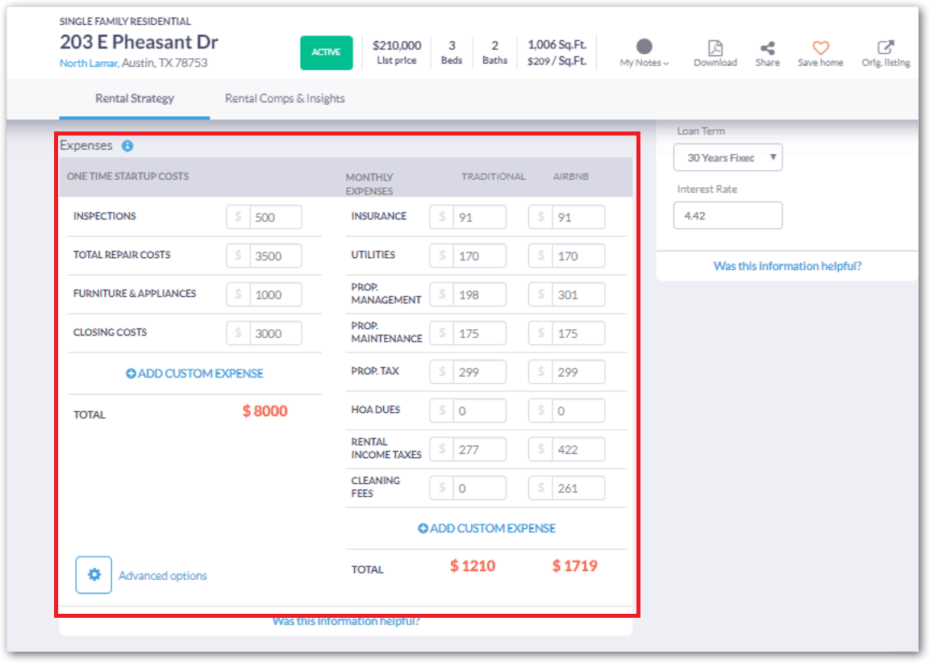
You'll also have all the expenses are broken down into One Time Startup Costs (i.e. – the costs you'll only have to pay when you first acquire the property) and Monthly Expenses (the costs you'll have to pay every month or year you own the property). Each expense is categorized and estimated for you based on rental comps and local rates, provided for both Traditional and Airbnb rentals.
IMPORTANT: In my experience running these numbers in the neighborhoods where my rentals are, I found that most of the automatically-generated inputs were surprisingly accurate. Even so, I still wouldn't trust any amount of artificial intelligence enough to make a major investment decision without verifying the accuracy of every number as it relates to my specific property and situation.
I think this kind of intelligent data is a GREAT place to start. It can help you save gobs of time in weeding through a market full of lousy properties. However, it's still wise to verify the accuracy of every number (and even add/delete other expenses that may or may not be relevant) before investing your money. After you’ve made all the necessary changes, the rental property calculator will recalculate all metrics for you.
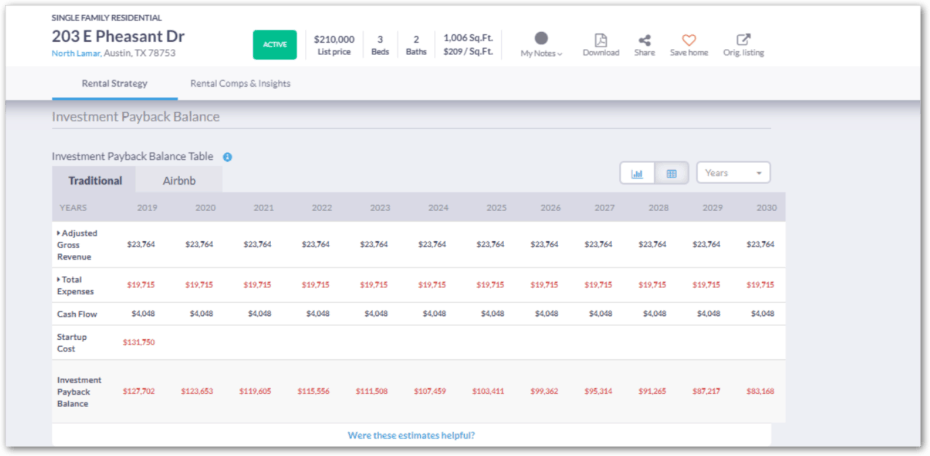
At the bottom of the Rental Strategy Page, you can see how many months or years it will take you to pay back your investment property and start having positive cash flow based on your preferred method of payment and your customized expenses.
Rental Comps & Insights
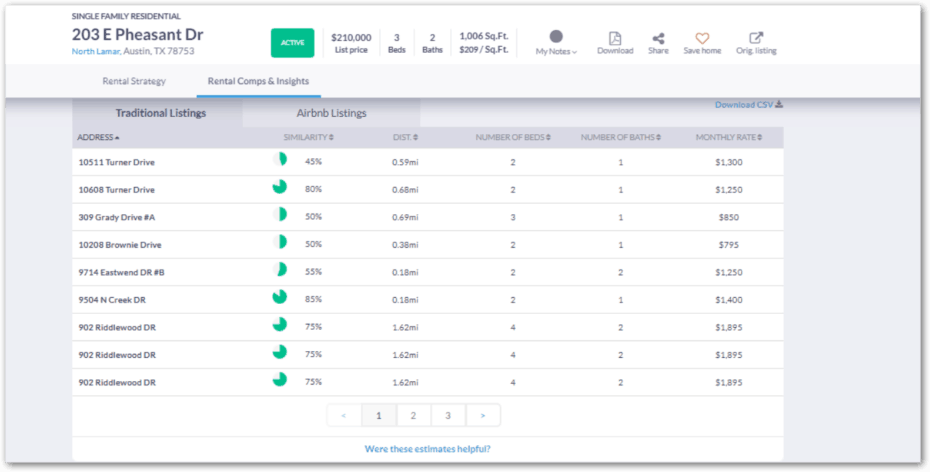
On the Rental Comps & Insights tab, you can see the rental comps (showing where all Mashvisor estimates are coming from). You will see a list of properties with the percentage of similarity to the property you are interested in, the distance from your property of choice, and other features, organized by Airbnb and traditional rentals.
Neighborhood Analysis
However, maybe you are not ready to look at a particular property yet, and you would rather have a look at a neighborhood to see whether it makes sense to invest in real estate there or not. In this case, you should head to the Neighborhood Analysis page.
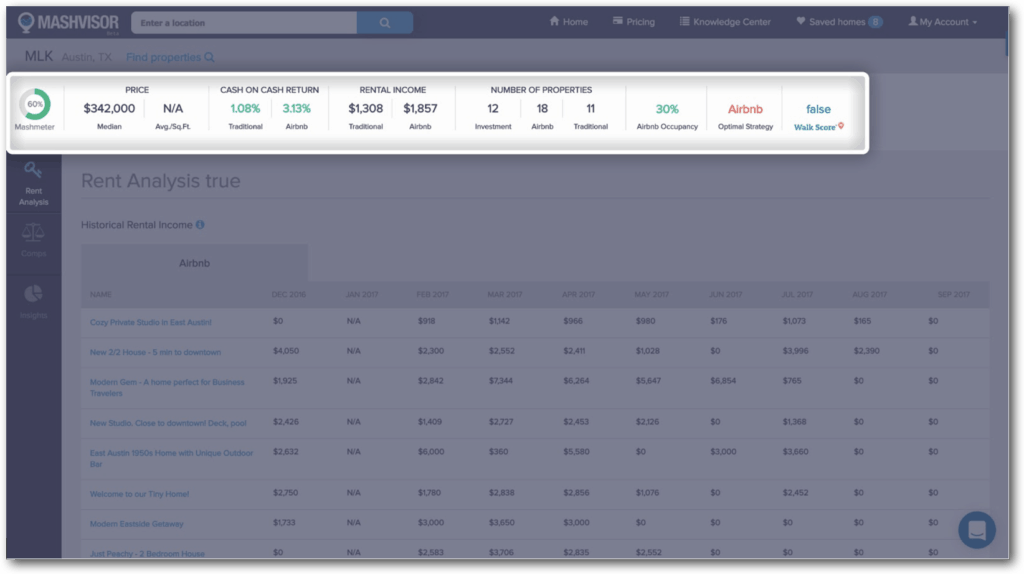
For any neighborhood, you can see the following insights:
- Mashmeter: an overall evaluation of how good a neighborhood is for buying a rental property
- Median Property Price
- Average price per square foot
- Average Traditional and Airbnb Cash on Cash Return
- Average Traditional and Airbnb Rental Income
- Number of Properties for Sale, number of Traditional Rentals, and number of Airbnb Rentals
- Airbnb Occupancy Rate
- Optimal Rental Strategy (Traditional vs. Airbnb)
- Walk Score
Rent Analysis
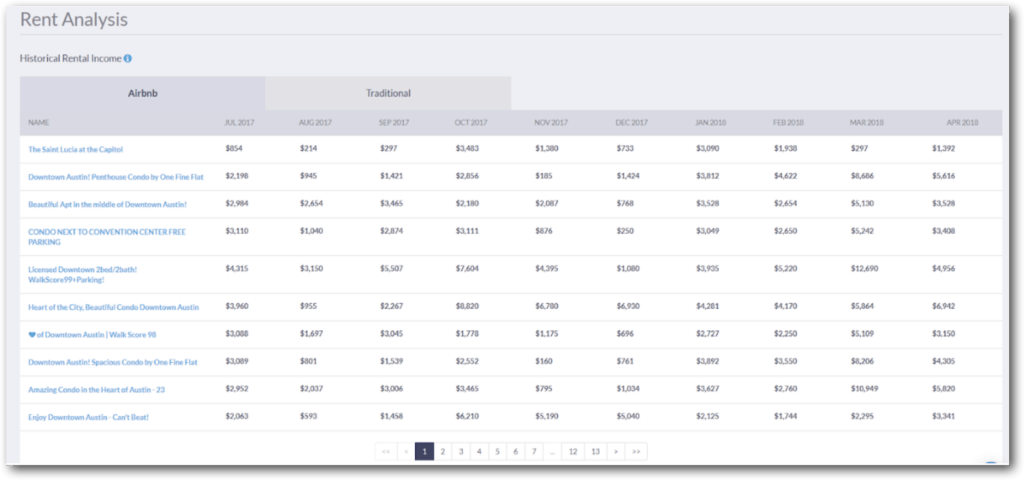
The Rent Analysis tab allows you to explore historical rental income for all properties in the neighborhood.
Comps
The Comps tab provides you with rental comps, i.e., properties previously sold in the neighborhood, including their sale price, price per square foot, sale date, property type, number of bedrooms, number of bathrooms, and square feet.
Insights
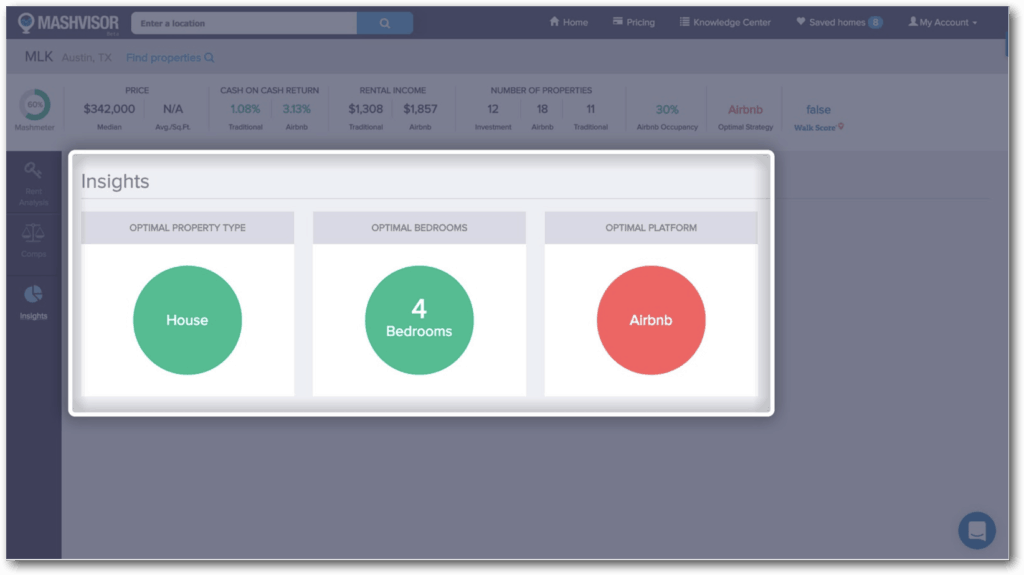
Last but not least, the Insights tab is very simple to use, and it will tell the user what the optimal options for an investment property in this particular neighborhood are, including:
- Optimal Property Type
- Optimal Number of Bedrooms
- Optimal Rental Strategy
Property Finder Tool
Another hidden gem baked into Mashvisor is the Property Finder tool, which allows you to set some basic filtering criteria and start searching in a targeted area for specific types of properties on the market.
For example, if I were looking for listed properties within a 50-mile radius of Grand Rapids, Michigan, in the range of $50K – $200K, with at least 1 bathroom and 2 bedrooms, the Property Finder tool would very quickly show me all the opportunities available along with their Cash on Cash Returns (for both the Traditional and Airbnb strategies).
This video offers a closer look at how it works…
Want to give Mashvisor a try? Sign up through our affiliate link and use promo code RETIP25. You'll get a 25% discount on your first payment and help support REtipster.com!
Important Benefit
One of the coolest features of the platform is that you are no longer limited to ONLY the properties publicly listed on the MLS (this was not the case a year ago when you could only see and analyze MLS properties). Now you have access to foreclosures, bank-owned homes, and short sales listed on Auction.com as well.
Moreover, you can now analyze off-market properties based on the comparable data of properties listed in the same neighborhood through the Property Marketplace. This is important for investors because many of the best investment opportunities never make it to the MLS. They’re bought and sold off-market, directly from the seller to buyer, sometimes with no agent involved.
If you’re looking for off-market opportunities (though direct mail or driving for dollars), you can use Mashvisor to analyze such properties' investment potential. Mashvisor also gives you access to property owner data to identify off-market opportunities and connect with the owners directly through your dashboard using an intuitive email setup.
What I Don't Like
To be clear, I don't think Mashvisor is a perfect system (yet). With all the useful features it offers, I think it's still missing some things.
It's worth acknowledging that the team has been actively improving the data and tools they offer (I've seen several iterations of improvement since I first discovered the site over a year ago), which is a great sign of what's to come.
At the time of this writing, I still think the “Insights” tab on the site needs some work, so users can see what data lives inside the numbers represented here.
It seems like their goal was to make this tab simple and easy to understand (because showing more information tends to confuse), but the fact that users literally CAN'T see any other information, in my opinion, makes it much less useful.
Should You Be Using Mashvisor?
I wouldn't say this service is an obvious, no-brainer service for every investor, but it could be quite useful to a certain type.
- Are you actively seeking new rentals (Traditional or Airbnb) in your market?
- Are you looking for new markets to invest in, but aren't sure where to start?
- Are you trying to save time in your initial analysis of investment opportunities?
- Are you trying to quickly identify the most glowing market opportunities while ignoring the bad ones?
- Do you need a faster way to find which areas have the highest occupancy rate for Airbnb rentals?
- Are you looking for the best Cash on Cash and Cap Rate opportunities for Traditional or Airbnb properties in a given market?
- Do you need help figuring out what you can charge for rent in a given area?
- Do you need to determine what kind of competition you'll be up against in a particular market?
If you answered “Yes” to any of these questions, then Mashvisor could be worth checking out.
RELATED: How to Buy 10+ Rental Properties in the Next 5 Years
It's true, you can do all of these things on your own, but they'll take A LOT more time, and these are some of the primary areas where Mashvisor can save you a ton of time.
What is your time worth? Is it worth $50 per month to find the best publicly-listed opportunities in minutes (rather than hours or even days)?
My time is worth much more than that, but we all come from a different places, and we all place a different value on our time (you know who you are).
In a nutshell, the Mashvisor platform helps you make faster and smarter real estate investment decisions. It eliminates the need for the tedious process of performing real estate market analysis and investment property analysis with spreadsheets and replaces them with a set of highly interactive real estate investing tools.
Want to give Mashvisor a try? Sign up through our affiliate link and use promo code RETIP25. You'll get a 25% discount on your first payment and help support REtipster.com!


