
REtipster features products and services we find useful. If you buy something through the links below, we may receive a referral fee, which helps support our work. Learn more.


When you’re deciding where to start looking for land deals, the numbers you look at can make or break your strategy.
There are a handful of common market research terms that get thrown around a lot, and while they’re all related, each one measures something different about a market.
No number on its own will tell you whether a market is “good” or “bad.”
These numbers only show you what is high vs low, fast vs slow, or consistent vs inconsistent.
What makes a market “good” depends largely on your strategy, your buy box, and your exit plan.
With that in mind, let’s go through the key terms you’ll see when researching land markets, what each one tells you, and why each of them is important.
Variables to Measure
To start with, we need to understand what we're measuring and why we're comparing these things against each other.
When we're evaluating a certain type of land (size, location, uses, etc), there are three types of property listings or ‘comps‘ we can use to determine what's happening in a market.
- Active Listings: The number of similar properties currently listed for sale in the market. It’s a snapshot of the current on-market supply at this exact moment.
- Pending Listings: These are similar listings that have accepted offers and are currently under contract to close, but the sale hasn’t closed yet.
- Sold Listings: The total number of similar properties that have successfully closed within a given historical timeframe. Sold listings show you where demand has already been proven, since a buyer has made a purchase.
Together, these three categories represent the supply available right now, the supply about to leave the market, and the demand already proven.
Before we start comparing these variables, it's important to define which properties we're trying to measure.
Defining Your ‘Buy Box'
To get an accurate read on any market, we first have to know: What kind of properties are we trying to buy?
- What size range are they?
- Where are they?
- How are they zoned?
- What attributes do they have?
There's no sense in measuring properties we don't even want to buy, right?
The more specific we can be about what we're looking for, the clearer we can search for the kinds of listings (active, pending, or sold) that actually matter to us.

By measuring the right things, our results will be more useful and relevant.
If we measure every listing in a given area without filtering for the types of properties we actually want to buy, we'll end up with a broad and often misleading result.
For example, if you have no plans to buy a 640-acre ranch, then exclude those properties from your search!
Likewise, if you're only looking for 50+ acre properties, then exclude properties that are far smaller than 50 acres.
Whether you're using a market research tool like Zillow or Redfin, or a paid tool, our findings will be much more useful if we define our criteria clearly from the outset.
If I know I intend to buy vacant residential lots between 1 – 5 acres in size, using this specific definition in all of my measurements will give me a very different (and more relevant) result than if I measure using ALL active listings without any other specifications.
The more clearly we can define our target property from the very beginning, the more relevant our results will be.
Defining Your Market Area
Lastly, it's important to define your market area.
For many land investors, the default definition of a market starts at the county level. Why? Because the county office maintains the property records and assessments within its borders.
When you're using a data service like Land Portal (for example), the search process typically begins by selecting a state and county. From there, you can start narrowing down your search for specific properties.
But is the county really the best way to define a market?
Maybe. Maybe not.
It depends on the county's size, what's happening within it, and how many factors influence property values from one end to the other.
Evaluating a market at the county level isn't necessarily wrong, but it isn't always the most precise way to understand property values.
If you can drill deeper into a more specific, geographically defined area, you'll usually end up with more relevant data and more accurate pricing information.
Fortunately, most data services allow you to narrow your search beyond the county level. You can filter by ZIP code, and tools like the Lasso feature let you draw a custom boundary around the exact area you're analyzing.
The key point is that a market isn't always defined by legal boundaries like county lines, city limits, or ZIP codes.
In many cases, markets are shaped by economic, geographic, or physical factors instead. A highway might separate two neighborhoods with very different property values. A mountain range or river can create natural barriers that affect accessibility and demand. Even things like school districts, proximity to a city center, access to paved roads, or distance from utilities can divide one area into multiple smaller markets.
In other words, the true market for a property is simply the area where buyers would realistically consider similar alternatives.
Your job as a land investor is to identify that area as accurately as possible, because the more precisely you define your market, the more reliable your pricing and demand analysis will be.
Rates and Ratios
Once we've decided on our market area, we can start measuring how supply and demand interact inside that market.
Let's talk about the metrics that help us understand how quickly properties are selling, how much inventory exists, and how consistently properties are priced.
1. Average Days on Market (DOM)
Average Days on Market (DOM) is the average (or sometimes the median) number of days properties are listed for sale before they finally sell.
If you've ever browsed properties on Zillow, you may have noticed the listing cards that show how many days each property has been listed for sale.
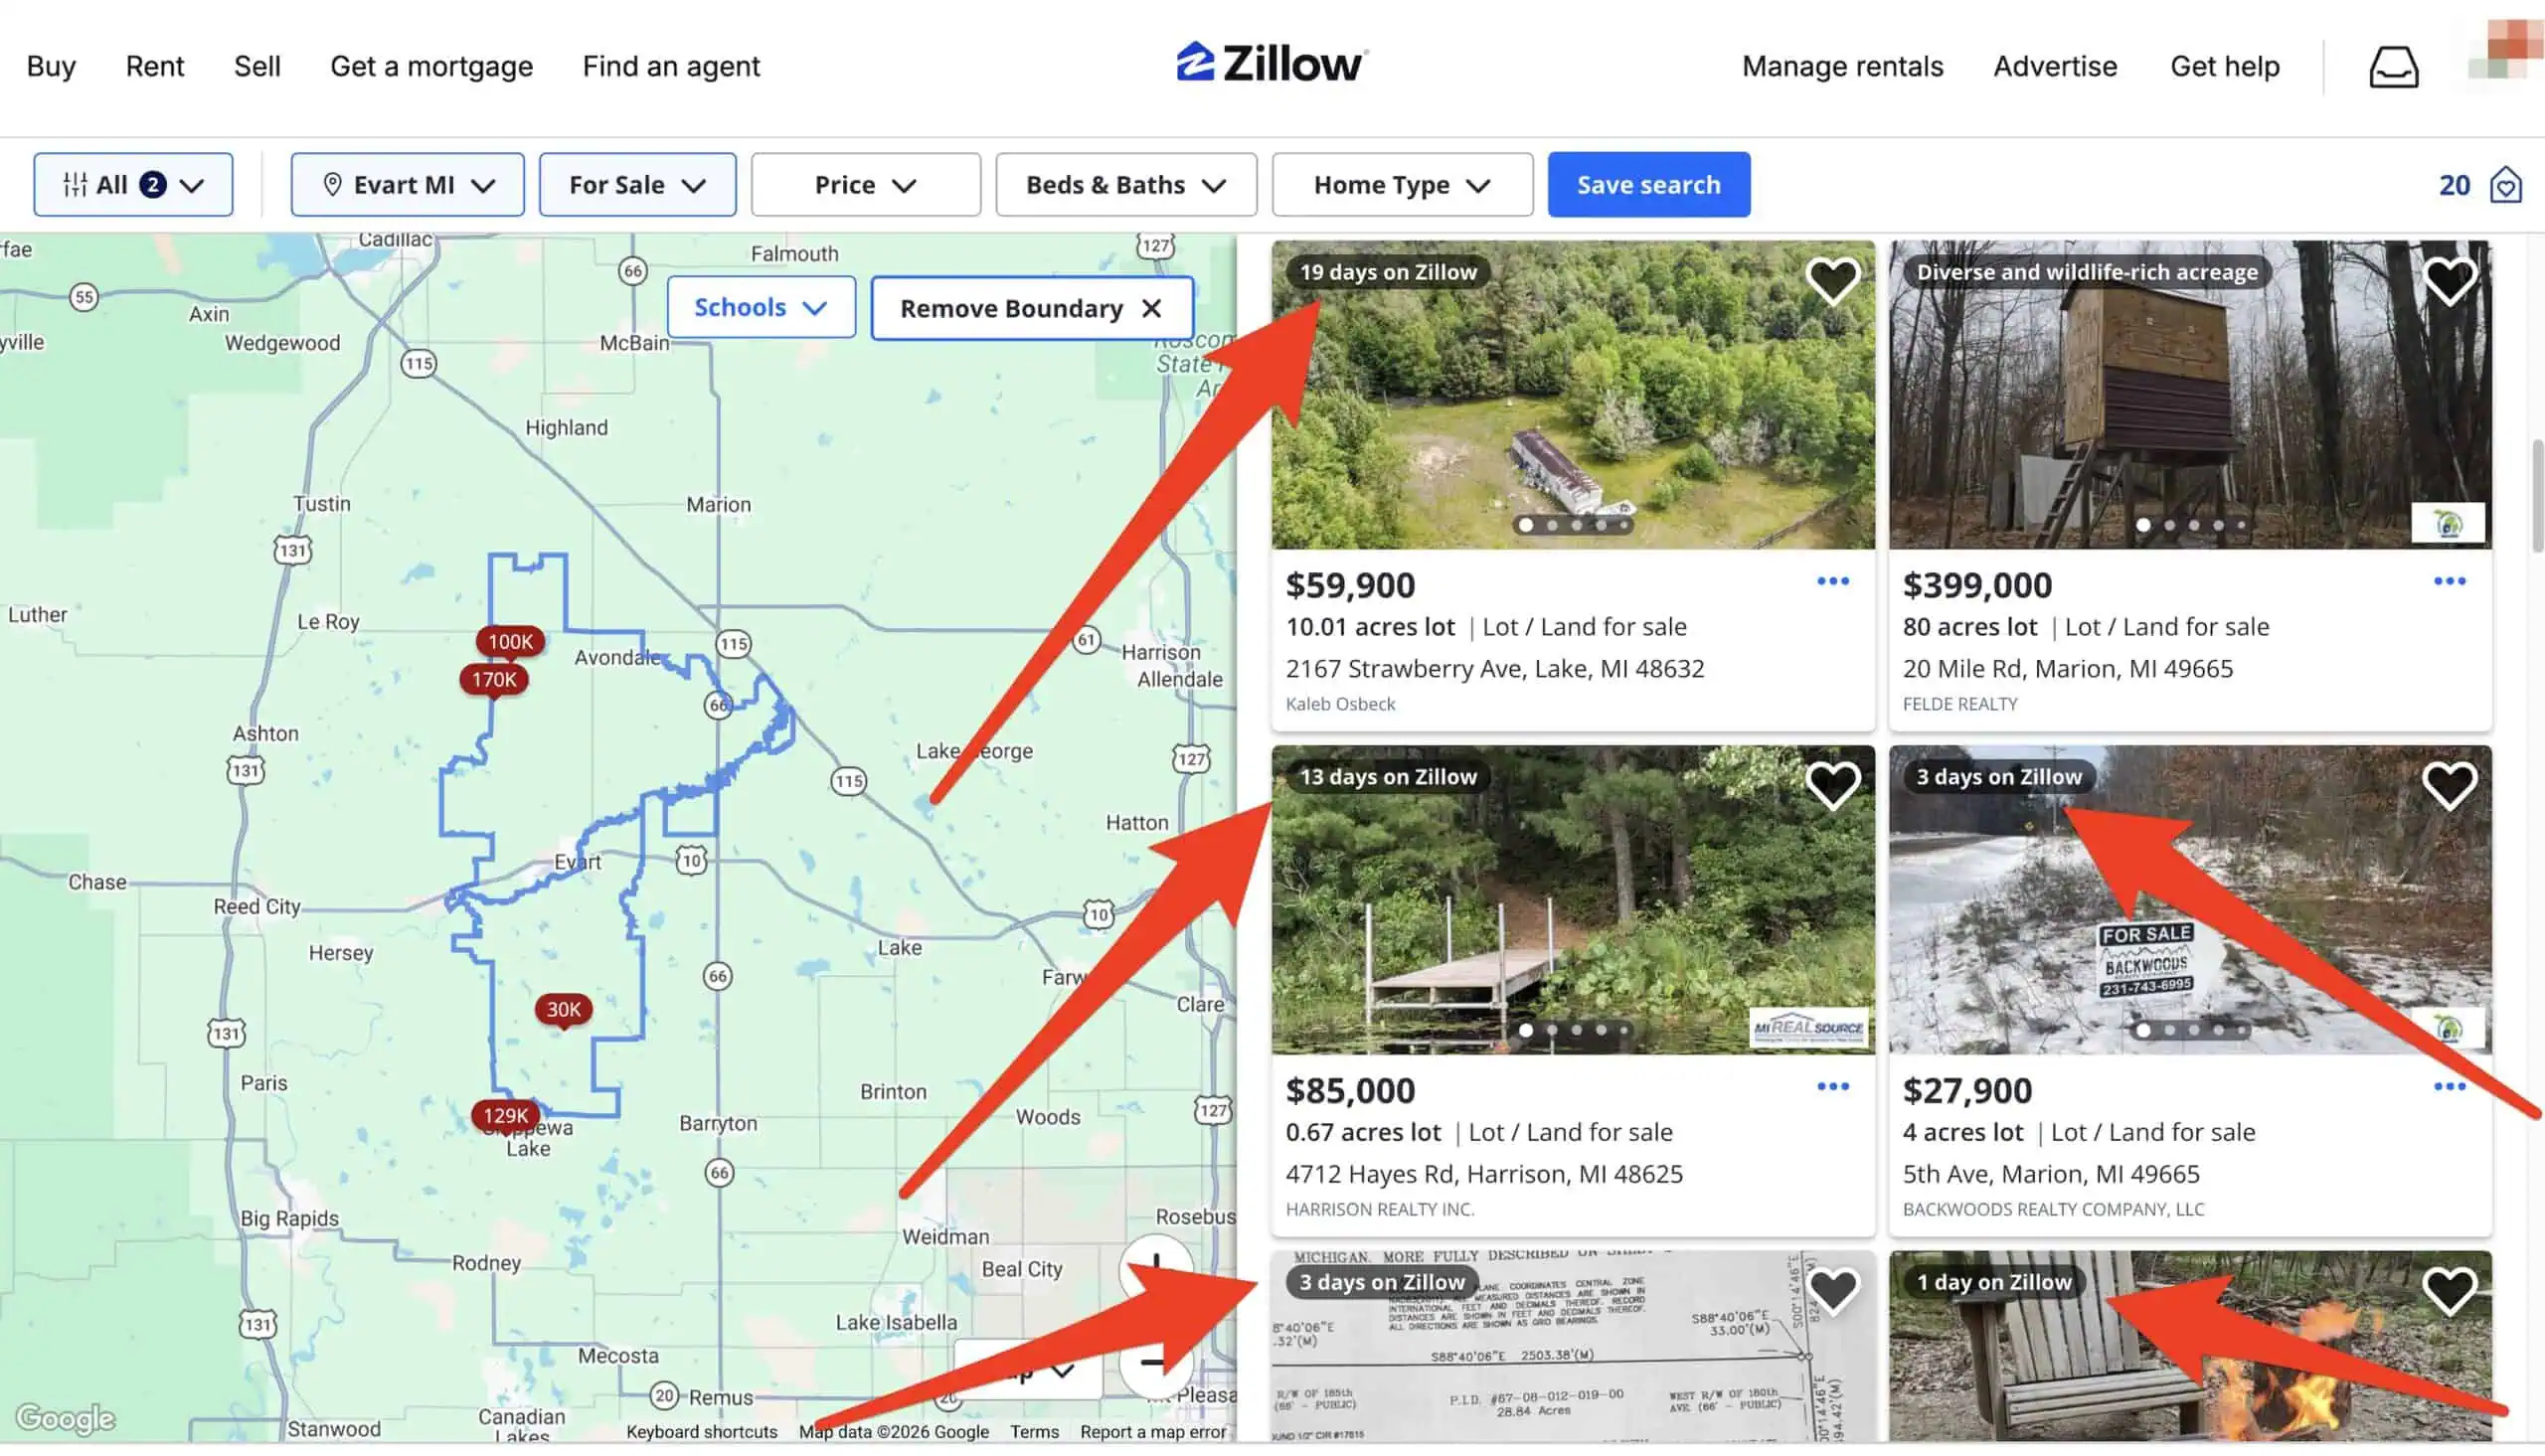
This number provides strong clues about buyer demand in a market (and for individual properties).
You can look at the DOM for current active listings, which tells you how long today’s inventory has been on the market.
Or you can look at the DOM over past sales and group them: How many sold in 30 days? 90 days? 180 days? 365 days?
For most real estate analysis, 12 months of sold data is the standard starting point.
The formula looks like this:
÷
In plain terms:
- Add up the number of days each property took to sell.
- Divide that total by the number of properties in the data set.
Simple Example
| Property | Days on Market |
|---|---|
| Property A | 30 |
| Property B | 45 |
| Property C | 15 |
| Property D | 60 |
Total DOM = 30 + 45 + 15 + 60 = 150
Number of properties = 4
Average DOM = 150 ÷ 4 = 37.5 days
So the average days on market would be about 38 days.
One Important Thing to Watch
For market analysis, you typically calculate DOM using sold listings rather than active listings. The reason is:
Sold listings show how long it actually took properties to sell.
Active listings are still accumulating days and could skew the number upward.
So the typical formula used by MLS systems and analysts is:
One More Tip
Because land markets often have extreme outliers (some parcels sit for 400 to 800 days), many analysts also look at the median DOM, which is the middle value rather than the average. It often gives a more realistic picture of demand.
Example:
DOM values:
12, 18, 20, 25, 30, 600
- The average would be 117.5 days (misleading)
- The median would be 22.5 days (much more realistic)
Again, if you're using Land Portal, it will group this data for you, making it easy to see.
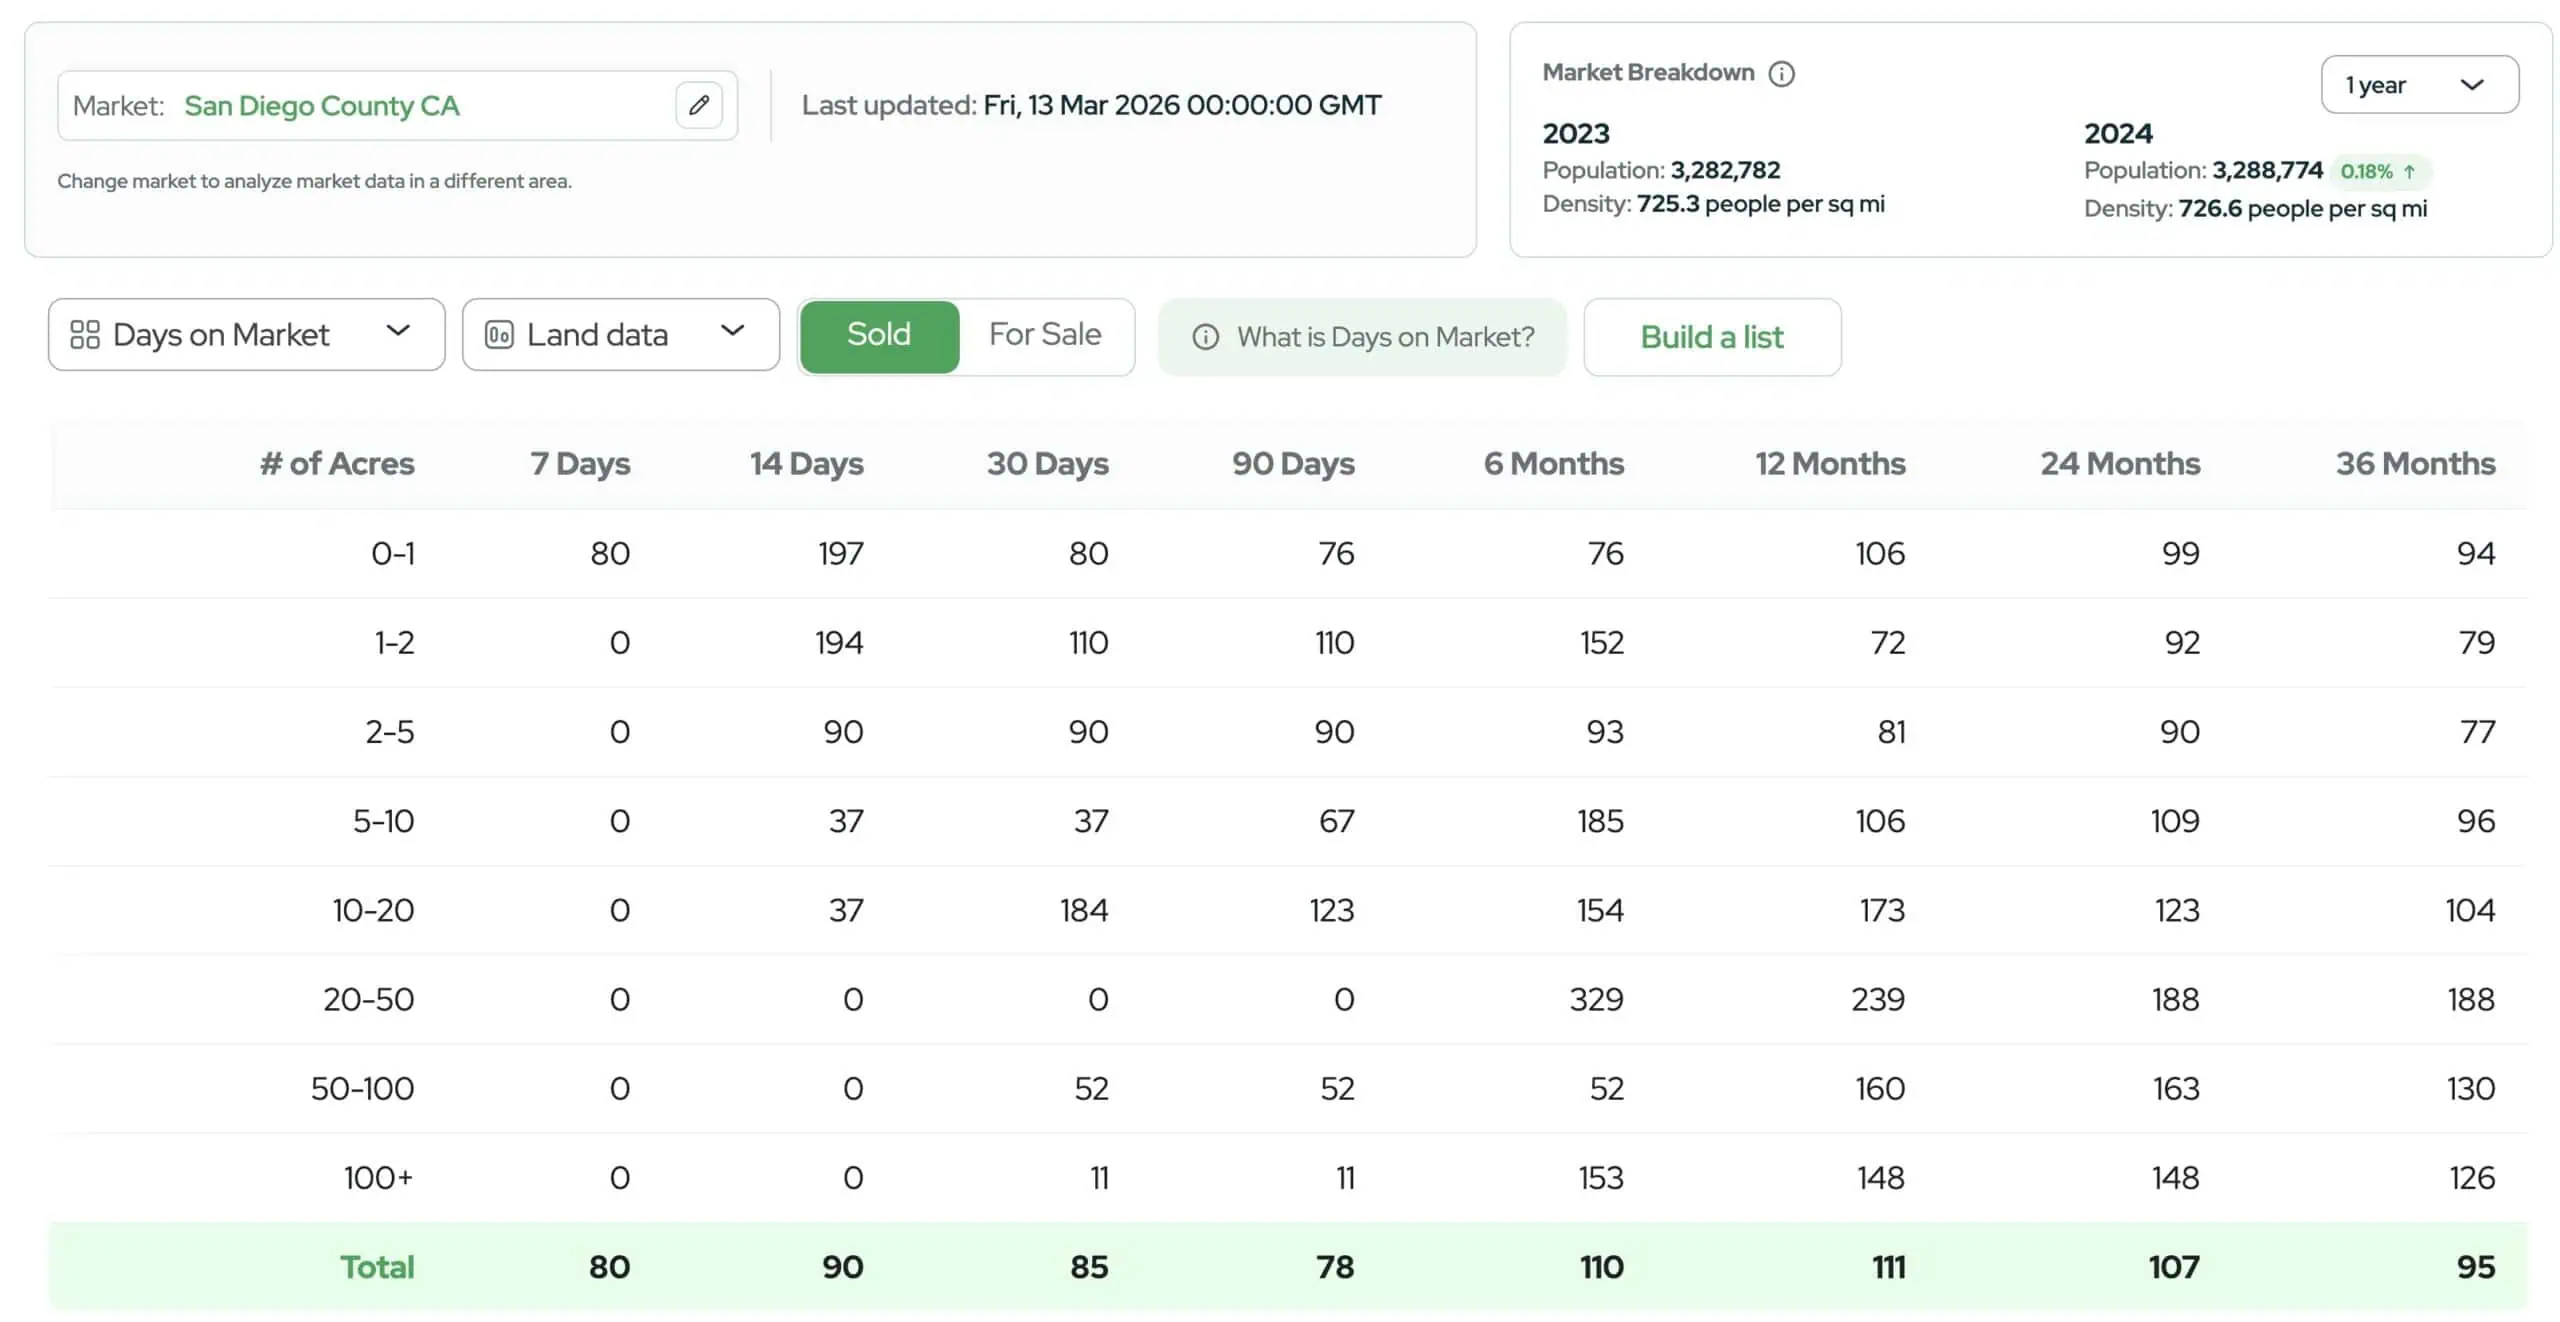
These clusters show you where the “sweet spot” tends to be for when most properties in that market actually move.
2. Sell-Through Rate (STR)
The Sell-Through Rate (STR) (also known as the Sold-to-For-Sale Ratio) measures a market's sales velocity by comparing sales over a given period to the number of current active listings.
The formula looks like this:
Sales in past 12 months ÷ Current Active Listings
This is essentially telling you the volume of properties that are selling compared to the inventory currently on the market.
For example, if 30 parcels were sold in the past year and 100 parcels are currently listed for sale, the sell-through rate would be:
30 ÷ 100 = 0.30
This means roughly 30% of the current inventory sold during that time period.
A higher STR (over 1.00) means demand is stronger compared to supply. A lower STR (lower than 1.00) means the inventory is sitting longer before it sells.
In practical terms, higher STR values indicate that buyers are consuming inventory quickly, while lower values suggest that listings are accumulating faster than they are selling.
This number doesn’t tell you precisely how long it will take all properties to sell (see Months of Inventory, below), it tells you how quickly properties are being eaten up relative to what’s available right now.
The Sell-Through Rate can also be calculated with a shorter time period, such as:
Sales in past 3 months ÷ Current Active Listings
Sales in past 6 months ÷ Current Active Listings
Sales in past 24 months ÷ Current Active Listings
There's an argument to be made that a shorter time period (such as 3 or 6 months) will be more relevant because the sales data is more recent. While this is a fair argument, these shorter timeframes also don't account for the seasonality in most markets (e.g., in many areas, especially the northern states, land sells faster in the warmer months than in the winter).
12 months is often a good happy medium that doesn't go too far back in time and accounts for seasonal changes in sales throughout the year.
Just keep in mind that if you use a shorter time frame, you should expect a lower STR ratio, because you aren't including as many months of sales in the formula.
RELATED: Finding the Best Markets for Land Investing
3. Absorption Rate
The term “Absorption Rate” is used in two slightly different ways in real estate market analysis. Both versions measure how quickly supply is being consumed by buyers, but they can express that information in different ways.
The key difference is whether we are measuring how many properties sell per month or what percentage of the current inventory has sold during a period.
Understanding both interpretations will help you better understand how analysts describe market demand.
Absorption Rate (Sales Pace)
The first and most traditional definition of absorption rate measures how many properties are being sold per month.
The formula looks like this:
Number of Properties Sold ÷ Number of Months
Suppose 60 parcels were sold during the past 12 months.
60 ÷ 12 = 5
This means the market's absorption rate is about 5 properties per month.
This version of the absorption rate is often used to calculate another important metric: Months of Inventory (see below).
Current Active Listings ÷ Average Monthly Sales
So if there are 50 active listings and the market absorbs 5 properties per month:
50 ÷ 5 = 10 months of inventory
In this case, it would take about 10 months for the current inventory to sell if no new properties were added.
Absorption Rate (Inventory Percentage)
A second definition of absorption rate measures the percentage of the current inventory sold during a given time period.
The formula looks like this:
(Properties Sold ÷ Current Active Listings) × 100
Suppose a market has sold 30 parcels in the past 12 months and currently has 100 parcels listed for sale.
30 ÷ 100 = 0.30
0.30 × 100 = 30%
This means the market absorbed 30% of the current inventory during that period.
How This Differs From Sell-Through Rate
At first glance, this second version of the absorption rate looks almost identical to the Sell-Through Rate (STR). Both compare the number of properties sold to the number of properties currently listed.
Sell-Through Rate = Properties Sold ÷ Current Active Listings
The difference is mostly in how the result is expressed:
- Sell-Through Rate is typically shown as a ratio (0.30)
- Absorption Rate is typically shown as a percentage (30%)
In practice, both metrics describe the same relationship between sales and current inventory.
What Each Metric Helps You Understand
Absorption Rate (Sales Pace): Shows how many properties the market can absorb each month. This is useful for estimating how long the inventory will last.
Absorption Rate (Percentage): Indicates the percentage of the available inventory sold during a period. This helps illustrate how aggressively buyers are consuming supply.
Sell-Through Rate: Shows the same relationship as percentage absorption, but expressed as a ratio rather than a percentage.
Because these metrics rely on similar inputs, many market research tools display them together. Each one simply highlights a different way of looking at the balance between supply and demand.
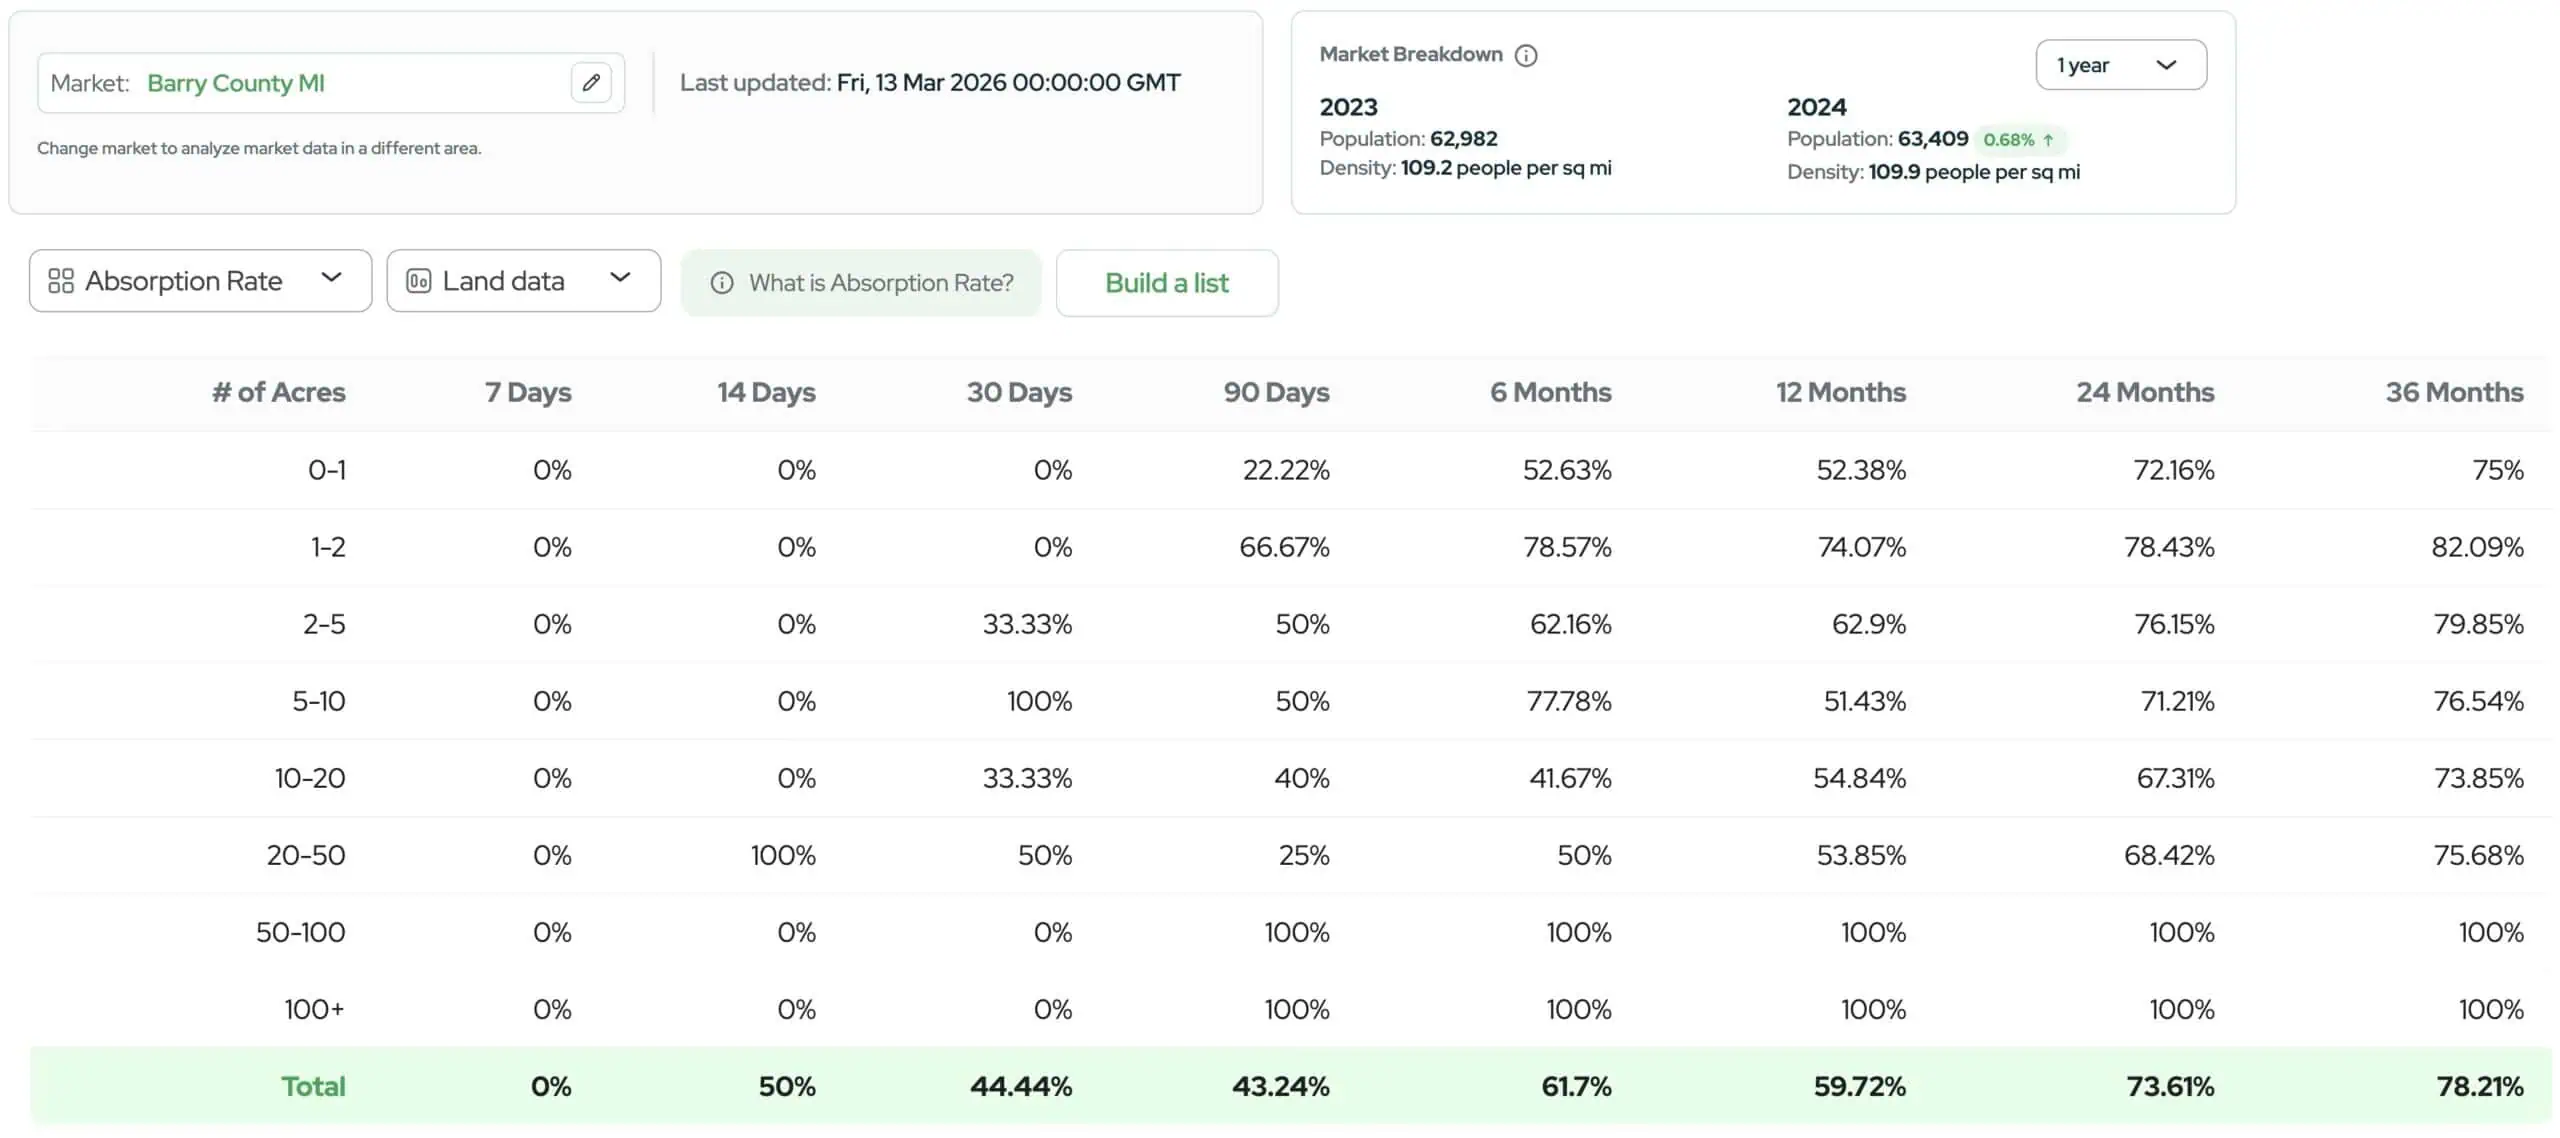
If you're using a tool like Land Portal's Market Research, it will show you all of these ratios across the board in the county you're looking in.
4. Months of Supply / Months of Inventory
Months of Inventory measures how long it would take to sell all active listings at the current pace of sales, assuming no new properties are added to the market.
The formula looks like this:
Current Active Listings ÷ Average Monthly Sales
To calculate average monthly sales, you first choose a time window (usually 6 or 12 months), then divide total sales by the number of months.
For example:
If there were 120 properties old over the past 12 months of sales in a market, you would have average monthly sales of:
120 ÷ 12 = 10 parcels per month
Now, to calculate inventory, if we have 50 active listings today, our ‘Months of Inventory' calculation would be:
50 ÷ 10 = 5 months of inventory
This means that if no new listings were added, it would take about 5 months for the market to absorb everything currently for sale.
In Land Portal, it will show you this calculation across a wide range of time windows, as shown below.
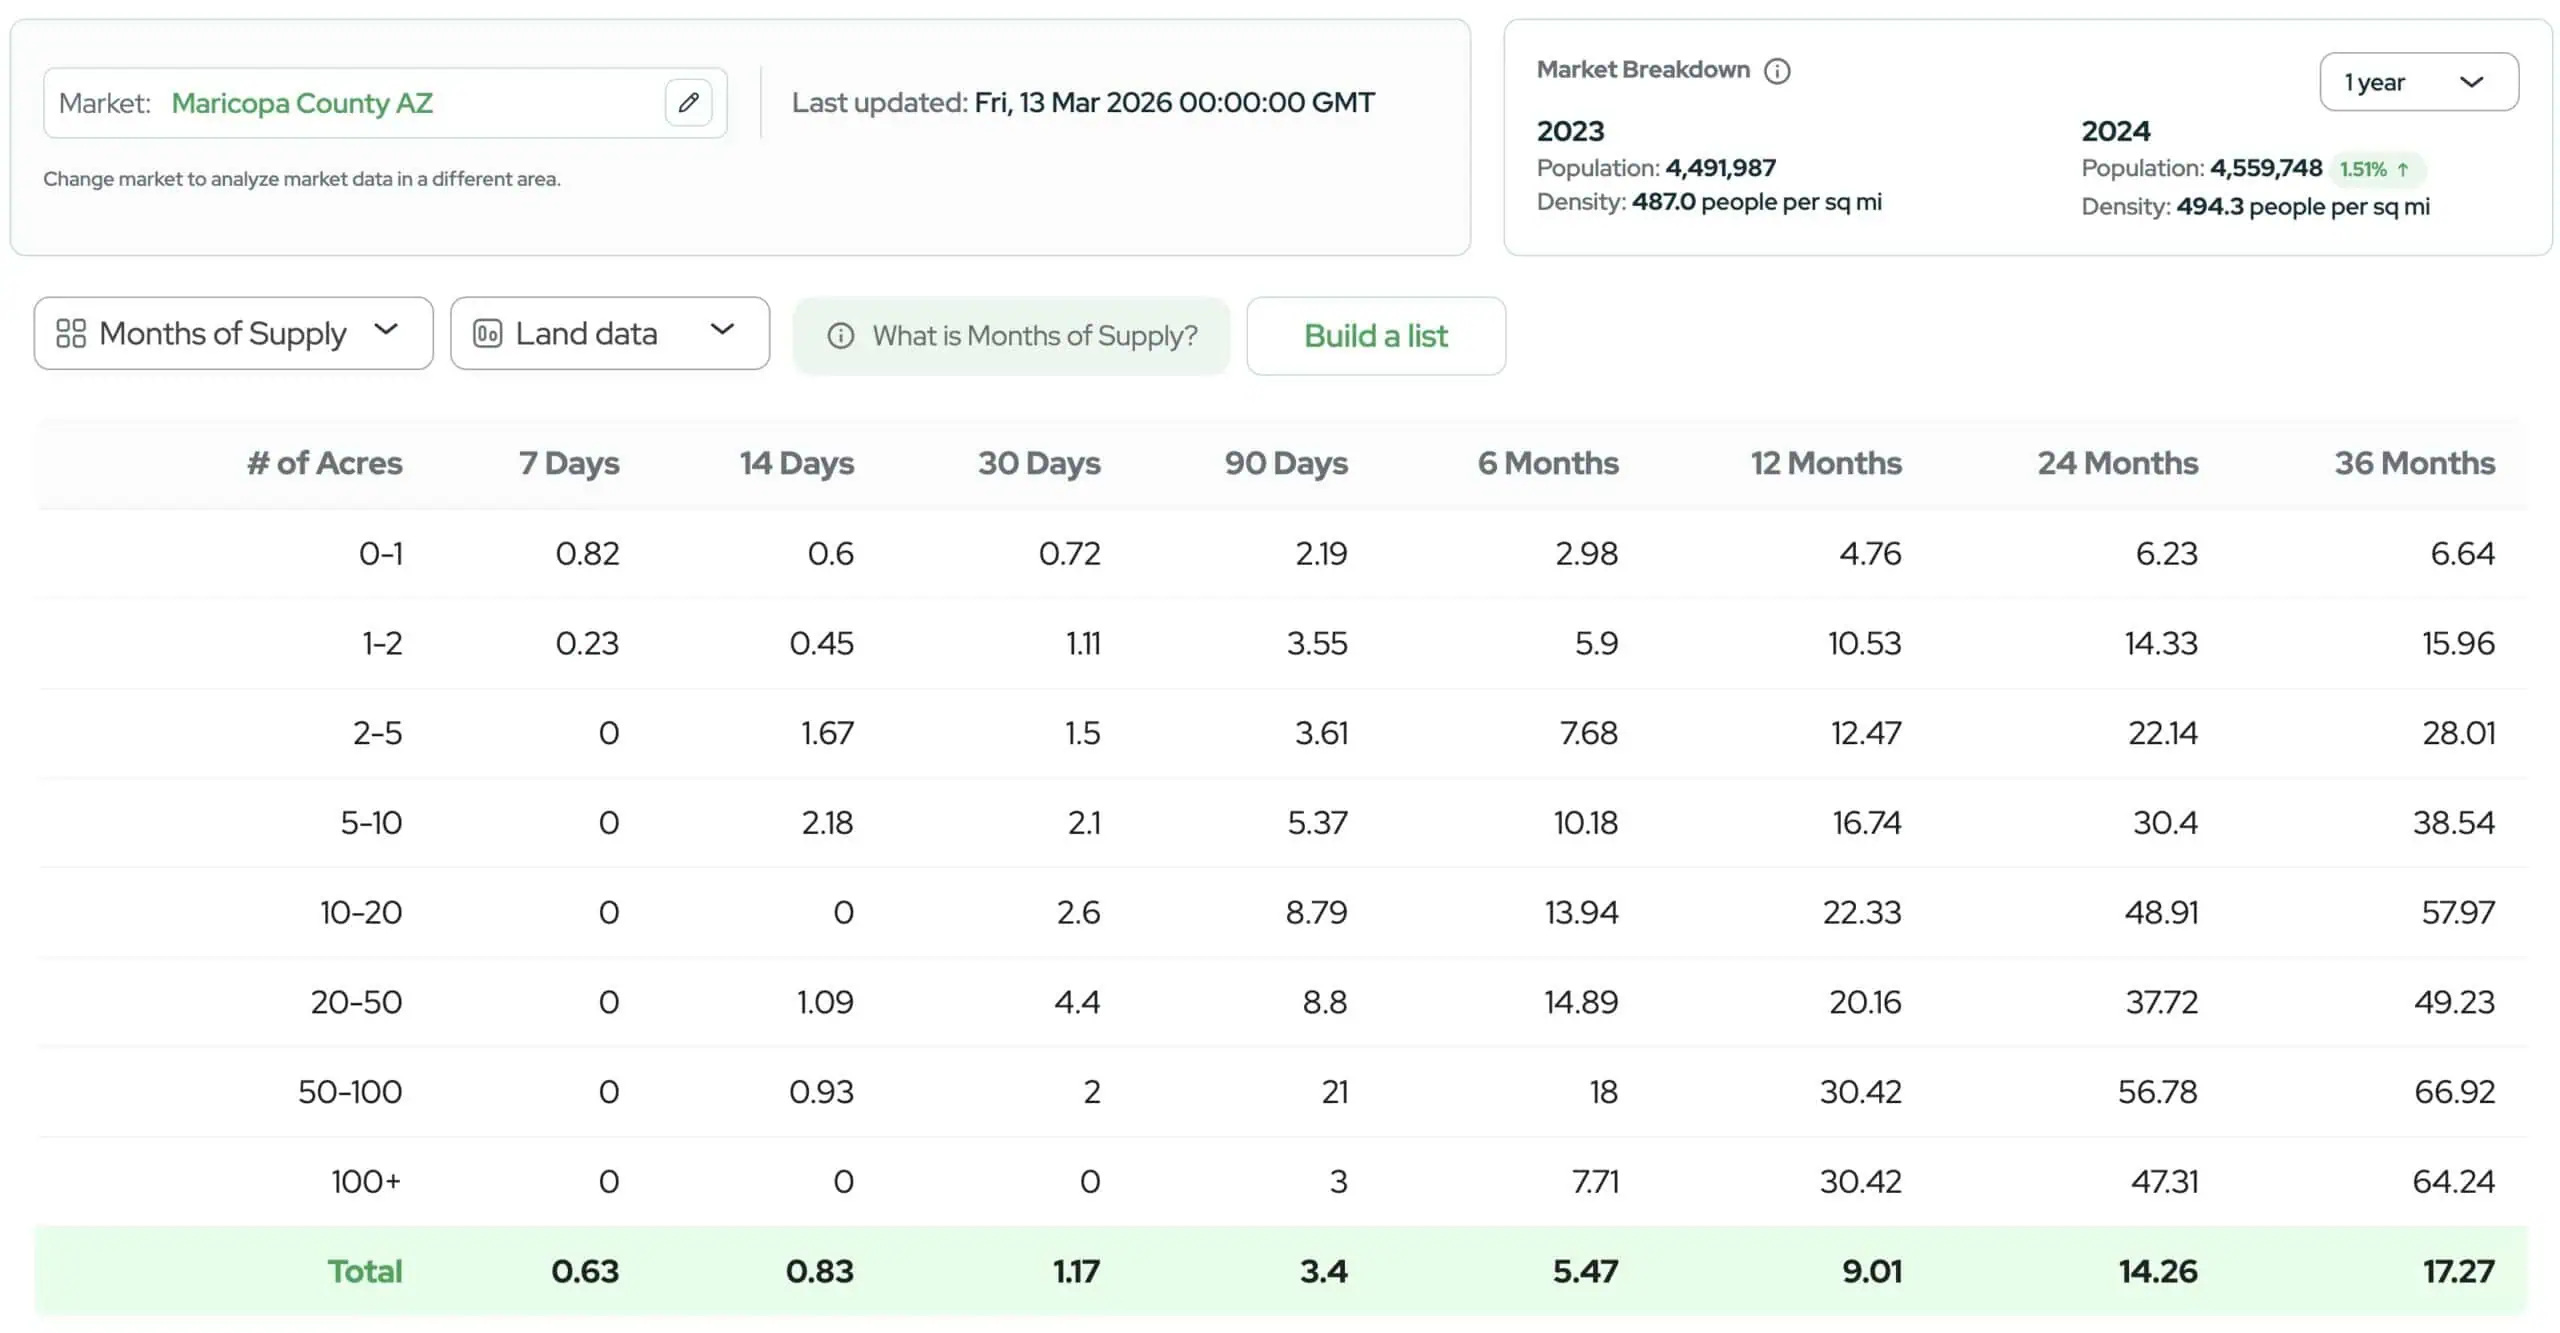
If you see 3 months of inventory, that means it would take about 90 days to sell everything currently listed, which is moving at a good clip.
On the other hand, a market with 12 months of inventory is moving much more slowly.
5. Median Price
The median price is the middle sale price of all properties sold within a given timeframe.
To find the median, you would list all sale prices from lowest to highest and identify the price in the middle. At that point, half of the properties sold for more and half sold for less.
Unlike the average price, the median is not heavily influenced by extreme outliers, such as unusually cheap or unusually expensive sales. Because of this, the median often gives a more realistic picture of what typical properties in a market are selling for.
Because land markets often include a few unusually high or low sales, the median price is usually a more reliable indicator of typical market value than the average price.
How to Calculate the Median Price
There isn't a traditional arithmetic formula like there is for an average. Instead, the calculation follows a simple process:
- Sort all sale prices from lowest to highest
- Identify the middle value in the dataset
If the number of sales is odd, the median is simply the middle number.
If the number of sales is even, the median is the average of the two middle numbers.
Example
Suppose five parcels sold for the following prices:
- $20,000
- $25,000
- $30,000
- $35,000
- $90,000
After sorting from lowest to highest, the middle value is $30,000, so the median price is $30,000.
Notice how the $90,000 sale does not distort the result?
Why Median Is Often Better Than the Average
If we calculated the average price instead, it would look like this:
Average Price = (20,000 + 25,000 + 30,000 + 35,000 + 90,000) ÷ 5
Average Price = $40,000
That average suggests properties are selling around $40,000, which is misleading. The median of $30,000 better reflects what most parcels actually sold for.
Calculating the median price manually is usually fairly labor-intensive, unless you have some good software that does it for you. Luckily, that's exactly what Land Portal can help us with, as shown in the screenshot below.
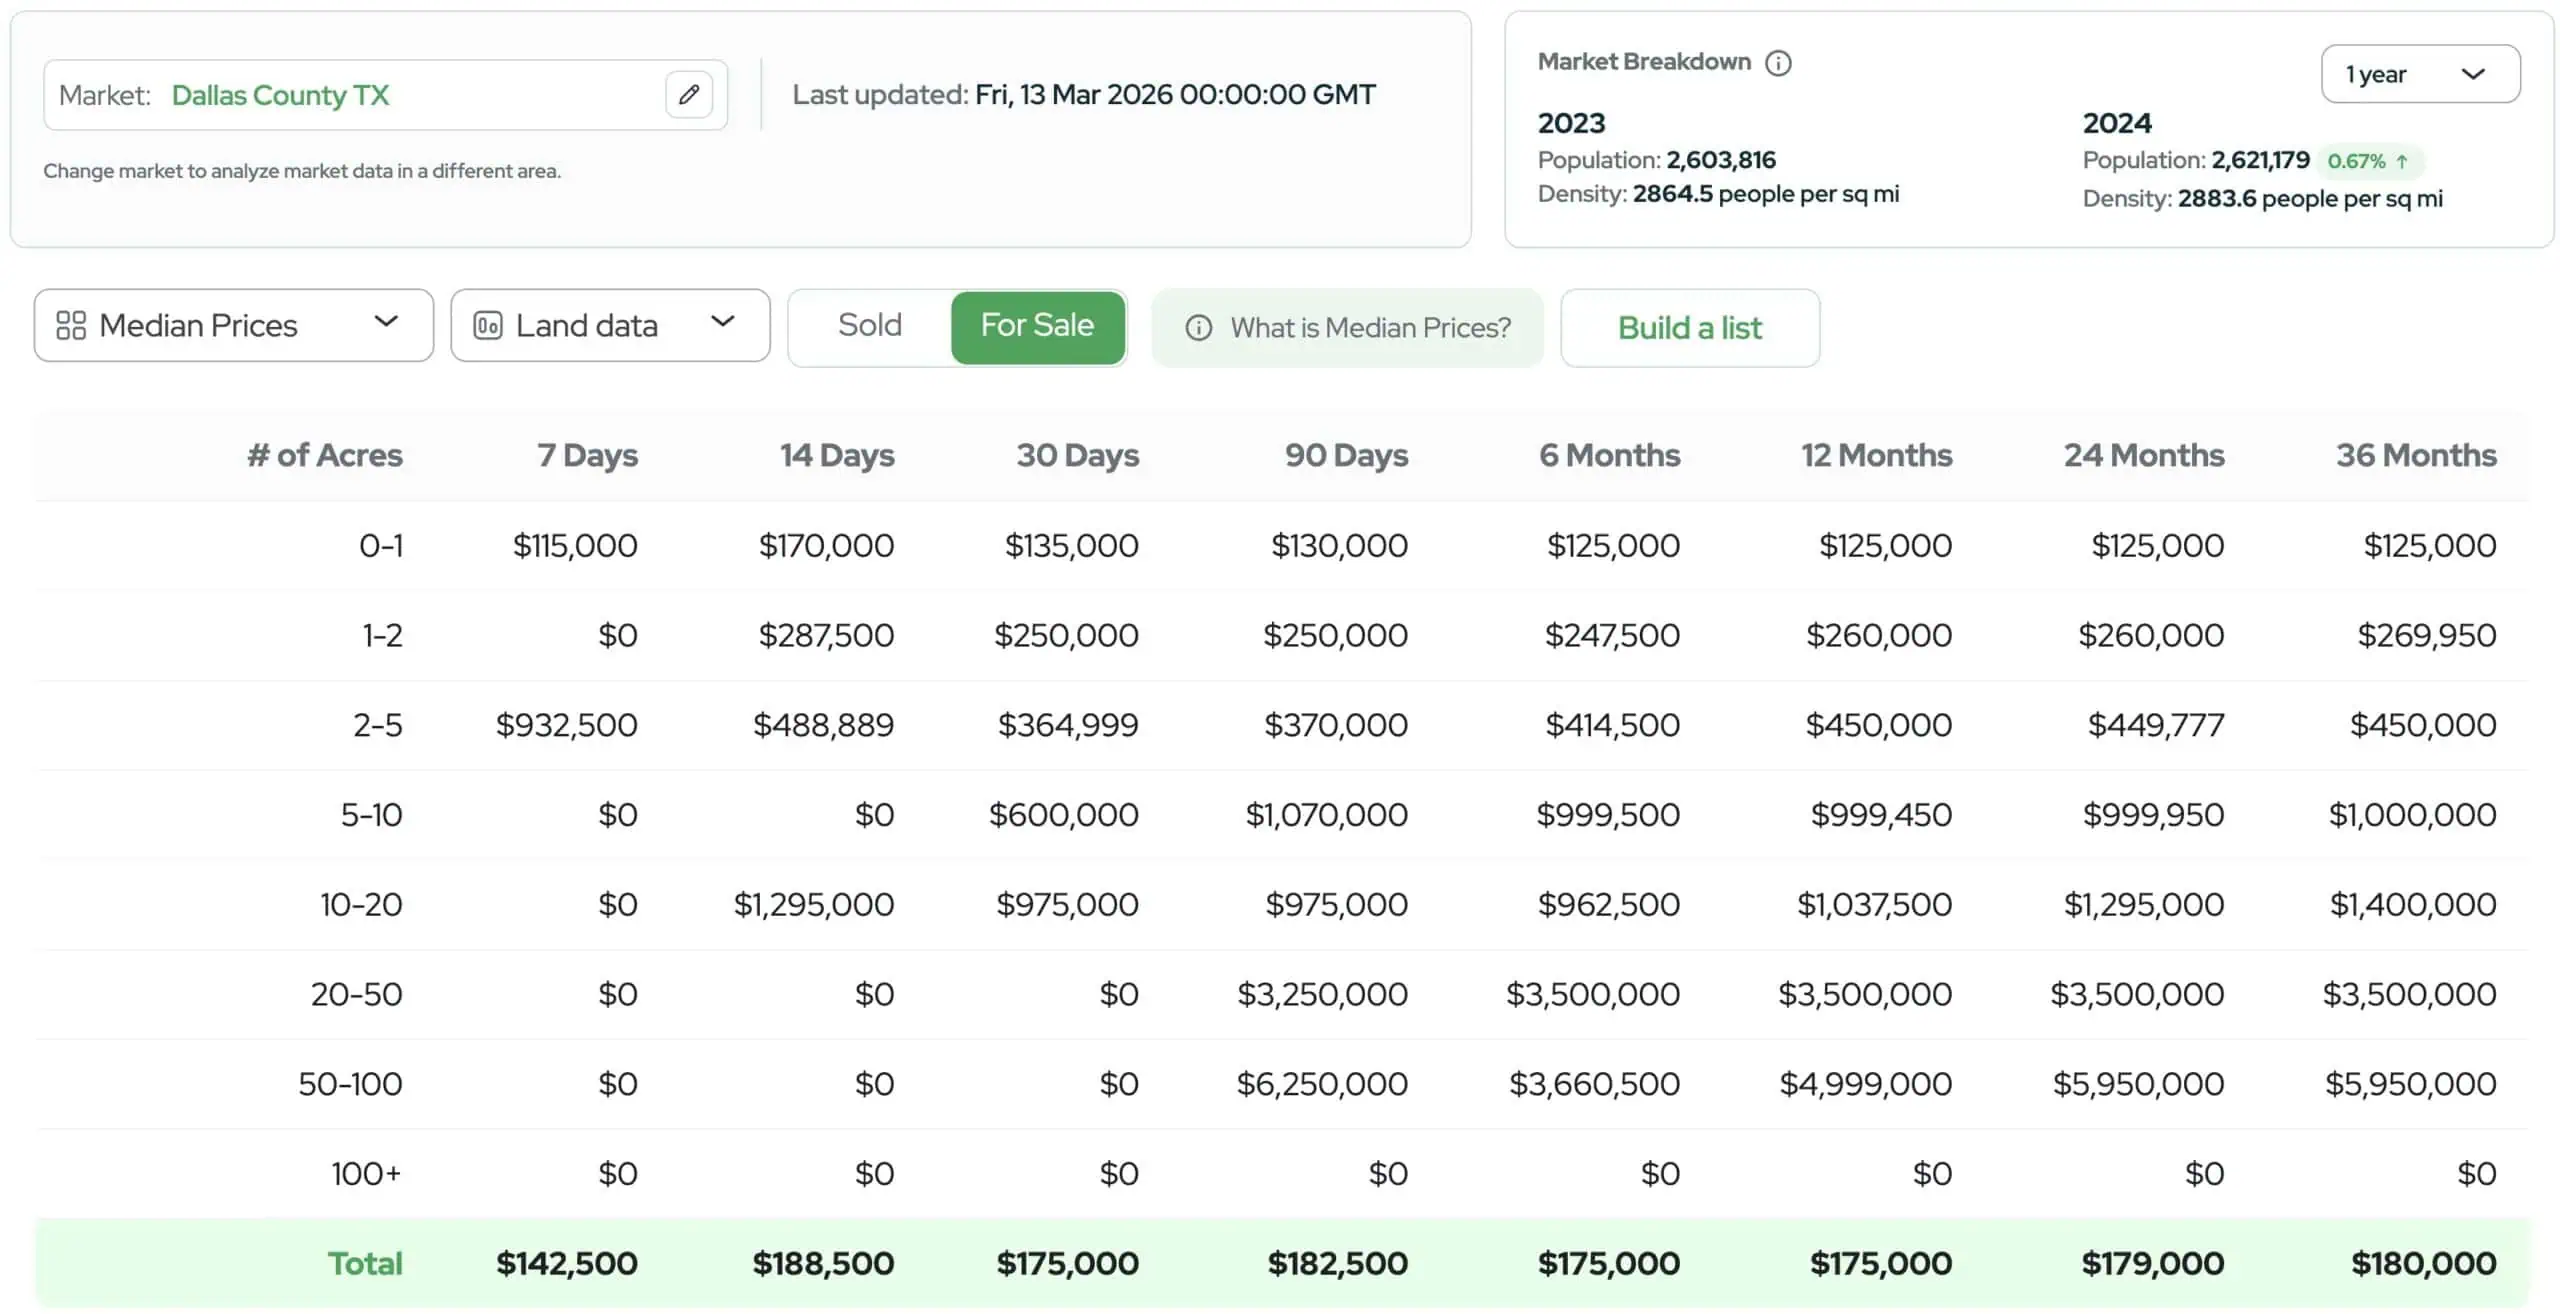
6. Median Price Per Acre
While the median sale price tells you the typical price of a property in a market, it doesn't account for differences in parcel size. A 1-acre lot and a 40-acre tract may sell for very different prices, even though the smaller property may actually be more expensive on a per-acre basis.
This is where the median price per acre becomes useful.
The median price per acre measures the middle value of all sale prices when each property is converted to a price-per-acre basis. This allows you to compare properties of different sizes more accurately.
Formula
First, calculate the price per acre for each sold property:
Price Per Acre = Sale Price ÷ Number of Acres
Then sort all price-per-acre values from lowest to highest and identify the middle value.
The result is the median price per acre.
Example
Suppose the following parcels were sold in a market:
- 2 acres sold for $20,000 → $10,000 per acre
- 5 acres sold for $35,000 → $7,000 per acre
- 10 acres sold for $60,000 → $6,000 per acre
- 20 acres sold for $80,000 → $4,000 per acre
- 40 acres sold for $120,000 → $3,000 per acre
After sorting the price-per-acre values:
- $3,000
- $4,000
- $6,000
- $7,000
- $10,000
The middle value is $6,000 per acre, so the median price per acre is $6,000.
Why Price Per Acre Matters
Median property price alone can sometimes be misleading because parcel sizes vary so widely. A market with many large rural tracts may show a high median price, even though the land itself is selling relatively cheaply per acre.
By looking at the median price per acre, you can normalize these differences and better understand what buyers are actually paying for land.
For land investors, this metric is particularly useful when:
- Comparing properties with different acreage sizes
- Evaluating whether a deal is priced above or below market
- Understanding how land values change as parcel sizes increase or decrease
Most markets show a predictable pattern where smaller parcels sell for a higher price per acre, while larger tracts sell for less per acre. Looking at price per acre helps you recognize these patterns and price properties more accurately.
7. Homogeneous Pricing
Homogeneous pricing refers to the consistency of property values within a market.
In a highly homogeneous market, similar properties tend to sell for very similar prices. For example, if most 5-acre parcels in an area are selling for between $30,000 and $35,000, that suggests the market is pricing those properties consistently.
On the other hand, a market with low homogeneity will show some big price differences between similar properties. If one 5-acre parcel sells for $20,000, another for $35,000, and another for $60,000, it becomes much harder to identify a clear market value.
The more homogeneous a market is, the easier it becomes to estimate property values, identify good deals, and set realistic pricing expectations.
Why Homogeneity Matters
Markets with highly consistent pricing make valuation much easier because comparable sales tend to cluster within a narrow range. This allows investors to confidently estimate a property's likely value based on nearby sales.
When pricing is inconsistent, however, it becomes much harder to determine what a property is truly worth. Large variations may indicate differences in access, terrain, utilities, zoning, views, or other property characteristics that are not immediately obvious.
Understanding how homogeneous a market is can help you assess the reliability of comparable sales when estimating value.
How to Recognize a Homogeneous Market
A simple way to judge pricing consistency is to look at how tightly comparable sales cluster around the typical price.
- Within about 10% of each other → very homogeneous market
- Within about 10–20% → moderately consistent pricing
- More than 20% variation → inconsistent pricing, requiring closer analysis
Land investors usually evaluate homogeneity by looking at price per acre among similar parcel sizes. When comparable properties consistently sell within a narrow range, the market becomes much easier to analyze and price accurately.
Example: Homogeneous vs Heterogeneous Pricing
Land investors often see homogeneity most clearly when looking at price per acre rather than total sale price.
For example, consider the following sales:
| Parcel | Acres | Sale Price | Price per Acre |
|---|---|---|---|
| A | 5 | $32,000 | $6,400 |
| B | 5 | $33,500 | $6,700 |
| C | 5 | $31,000 | $6,200 |
This is a very homogeneous market because the price per acre is tightly clustered.
Now compare that to this example:
| Parcel | Acres | Sale Price | Price per Acre |
|---|---|---|---|
| A | 5 | $20,000 | $4,000 |
| B | 5 | $35,000 | $7,000 |
| C | 5 | $60,000 | $12,000 |
This is a very heterogeneous market because the price per acre varies widely between comparable properties.
How These Numbers Work Together
Think of these metrics as three different lenses:
- Velocity (how fast properties sell)
- Supply balance (how much inventory exists)
- Pricing (what buyers are paying)
Each metric gives you a different angle on supply, demand, velocity, and pricing. None of them defines a market as universally good or bad. They just describe what’s happening.
A high sell-through rate might indicate strong demand, but if your buy box is ultra-cheap infill lots, that might not matter.
A county could look bad on paper, but a trophy property will still sell quickly and make great money.
Some markets have 12 months of supply, yet you can still find motivated sellers and flip properties profitably.
The Hidden Problem With Market Research Tools
Market research tools are fantastic, but there’s a downside.
Because these tools highlight the “hot” counties, they also push large numbers of investors into the same markets at the same time. The result is overcrowding, with property owners receiving the same letters and the same low offers from dozens of investors.
If you treat these tools as if they are telling you what’s objectively good or bad, you’ll end up in the herd.
The reality is that there are great deals in bad markets and terrible deals in good markets, even when the numbers look good.
A trophy property will still sell quickly in a zip code that looks terrible on paper, because what matters is the property itself, not the county average.
Final Thoughts
Market research is powerful, but only if you use it wisely. Don’t let the numbers trick you into thinking they define what’s “good” or “bad.” They only tell you what’s high, low, fast, or slow.
The best investors use these metrics to sharpen their buy box, find overlooked pockets within a county, and understand the playing field. They don’t blindly follow the herd into the same crowded places.
If you can learn to read these numbers the right way, you’ll see opportunities where most people only see noise.