






Most investors evaluate rural markets using backward-looking metrics such as population growth, median home prices, and recent appreciation. The issue is that those numbers tell us what already happened.
During my years as a Realtor and investor in Montana and Wyoming, I became increasingly interested in a different question:
Why do some small towns grow while others never seem to break out?
Communities like Bozeman, Bend, and Driggs didn’t become growth markets overnight. The forces that shaped their trajectories were often visible years before population statistics, home prices, and national headlines reflected them. At the same time, I’ve watched other communities with seemingly similar advantages struggle to generate the growth many investors expected. That experience led me to focus less on growth results and more on the conditions that tend to create them.
No framework can predict the next Bozeman or Bend with certainty, but markets that sustain growth often share similar characteristics long before demographic data catches up. This article outlines a framework for evaluating rural and secondary markets through four lenses: infrastructure, economic drivers, lifestyle multipliers, and catalysts.
Why Population Growth Is a Lagging Indicator
One of the first numbers investors look at when evaluating a market is population growth. That makes sense. More people usually means more housing demand, more businesses, more services, and more real estate activity. The problem is timing.
By the time a market shows up on “fastest-growing cities” lists, much of the early opportunity may already be gone. Land values have moved, rents have adjusted, competition has increased, and local investors have often been positioning themselves for years. Population growth tells us what happened. It’s not necessarily the best indication of what happens next.
The same is true of home prices. Rising values usually reflect demand that already exists. I still look at population and price trends, but I think of them more as confirmation than prediction. If I’m trying to understand where a smaller market may be headed, I want to know what is creating the demand in the first place.
The question I keep coming back to is: What conditions are creating future demand before population growth becomes obvious?
Those clues usually show up somewhere else first: transportation and utility capacity, employers and institutions that create economic pull, lifestyle advantages that make people want to stay, or a catalyst that changes how a market functions. None of those guarantees growth. But together, they can tell you much more about where a market may be going than a population chart alone.
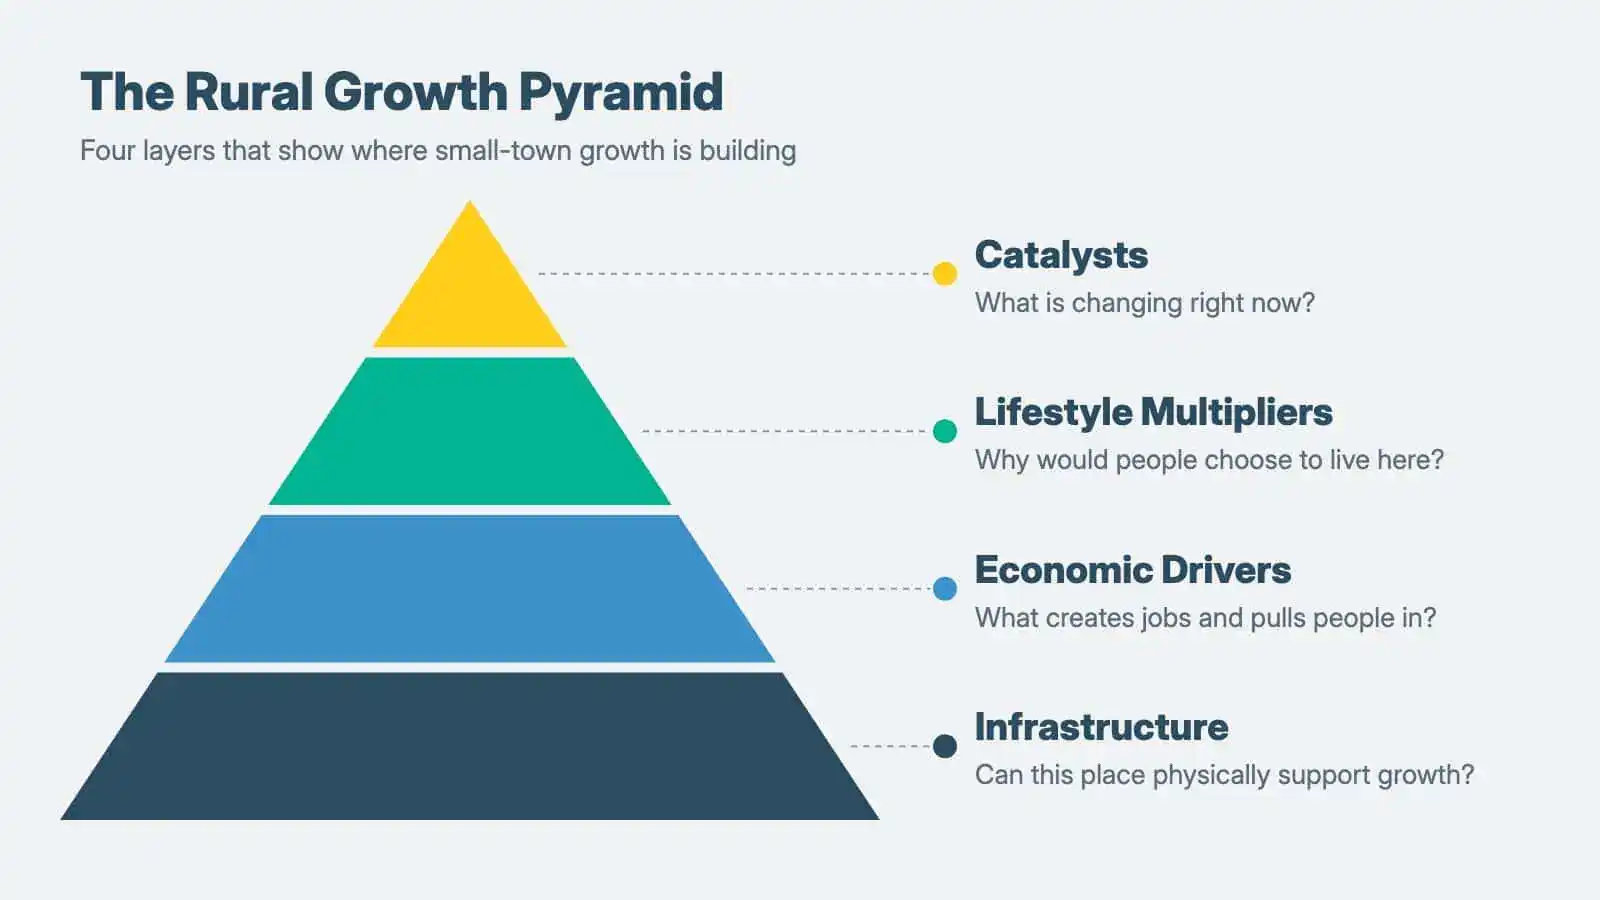
That is what the Rural Growth Pyramid is meant to evaluate.
The Rural Growth Pyramid
While every market is different, the strongest rural and secondary markets usually have more than one thing working in their favor. A ski area alone is not enough. Neither is a university, a new employer, or cheap land.
I think of the pieces as a pyramid. Infrastructure sits at the base: roads, airports, utilities, water, sewer, fiber, and the basic capacity to absorb growth. Economic drivers come next: universities, hospitals, employers, industry, government, or regional services that create jobs and pull activity into a market. Lifestyle multipliers (recreation, scenery, public lands, climate, and quality of life) make people more willing to choose one place over another. Catalysts sit at the top: a major project, airport expansion, resort, employer, or private investment that can speed up a change already underway.
A market does not need a perfect score in every layer. But the more of these forces that reinforce one another, the stronger the case that demand can last.
Layer One: Infrastructure
Before a market can grow, it has to be able to support growth. That sounds obvious, but it is easy to spend more time on demographics than on the systems underneath them.
Transportation is the clearest example. A town may look close to a major employment center on a map, but winter weather, mountain passes, congestion, or poor roads can make that distance much less practical. Accessibility is not measured in miles alone. It is measured in reliability.
Utilities matter just as much. Water, sewer, power, and fiber rarely make a real estate listing, but they can decide whether a project gets built at all. A community can have demand and available land and still stall if its treatment plant is at capacity or utility extensions are prohibitively expensive.
When I look at a rural market, I want to know whether people and businesses can get there reliably, whether utilities can handle more growth, and whether any known infrastructure bottleneck is likely to slow development.
Case Study: Livingston, Montana
Livingston is a good example of why those details matter. It checks a lot of boxes: mountain views, outdoor recreation, a historic downtown, rail and interstate access, and Bozeman less than thirty miles away. It is easy to look at that and assume Livingston should simply follow Bozeman’s trajectory.
The drive is one reason that assumption gets complicated. A friend of mine lived in Livingston and commuted to Bozeman, and winter conditions occasionally made the trip impossible. High winds, drifting snow, ice, and overturned semis can turn a short commute on a map into something much less reliable.

Livingston has also faced utility-capacity constraints as development pressure has increased. Projects can be delayed while a community works through wastewater, engineering, funding, and permitting issues. That doesn’t mean Livingston cannot grow. It means growth is partly controlled by bottlenecks that are easy to miss if you look only at population and proximity.
That is the distinction I care about: not just distance, but accessibility; not just available land, but capacity.
Layer Two: Economic Drivers
Infrastructure makes growth possible. Economic drivers give people a reason to be there.
A town can have highways, utilities, and plenty of developable land, but without jobs and economic activity, demand is hard to sustain. I look for what pulls money and people into a market: universities, healthcare systems, manufacturing, agriculture, energy, government, tourism, or serving as the service center for a much larger rural region.
Economic Pull
I think of that as economic pull. Some communities naturally draw workers, students, patients, shoppers, businesses, and professional services from well beyond their city limits. That matters in rural areas, where a town’s economic reach can be much larger than its population suggests.
Case Study: Bozeman, Montana
Bozeman is often described as a lifestyle market, but its economic base matters just as much. Montana State University, healthcare, construction, tourism, professional services, and a surprisingly deep technology sector all give people reasons to build careers there, not just visit.
The numbers show how much changed once those forces started reinforcing one another. U.S. Census Bureau data show Bozeman grew from 37,280 residents in 2010 to 53,293 in 2020, an increase of about 43%.
That growth wasn’t driven by mountains or skiing alone. The lifestyle made Bozeman desirable; the university, employers, healthcare, transportation, and business ecosystem made the demand more durable. That is the kind of combination I look for.
Case Study: Driggs, Idaho
Driggs is a different kind of story because much of its demand is tied to a stronger neighboring market.
For decades it was a small agricultural and recreation-oriented community on the west side of the Tetons. As Jackson became more expensive, workers, business owners, retirees, and second-home buyers increasingly looked across the state line for alternatives that still offered access to the same broader region. The 2010 Census counted 1,660 residents in Driggs. By 2020, that had risen to 1,984, about a 20% increase.
Some towns generate demand internally through employers, healthcare, education, or industry. Others benefit from spillover. Spillover markets can still be excellent opportunities, but part of the thesis depends on the neighboring market staying strong.
Layer Three: Lifestyle Multipliers
Lifestyle amenities matter, but they usually work best as multipliers, not engines.
Skiing, fishing, hunting, public lands, scenery, climate, and a strong sense of place can make a market far more desirable. They attract visitors, retirees, remote workers, second-home buyers, and sometimes businesses. But beautiful places are everywhere. The markets that really accelerate tend to pair those amenities with infrastructure and economic opportunity.
Cody, Wyoming, where I live, shows the limits of lifestyle alone. It has exceptional recreation, tourism, and access to Yellowstone, but a smaller economic base and more limited connectivity have produced a very different growth trajectory. The 2010 Census counted 9,520 residents in Cody; by 2020, that had increased to 10,028, growth of just over 5% in a decade.
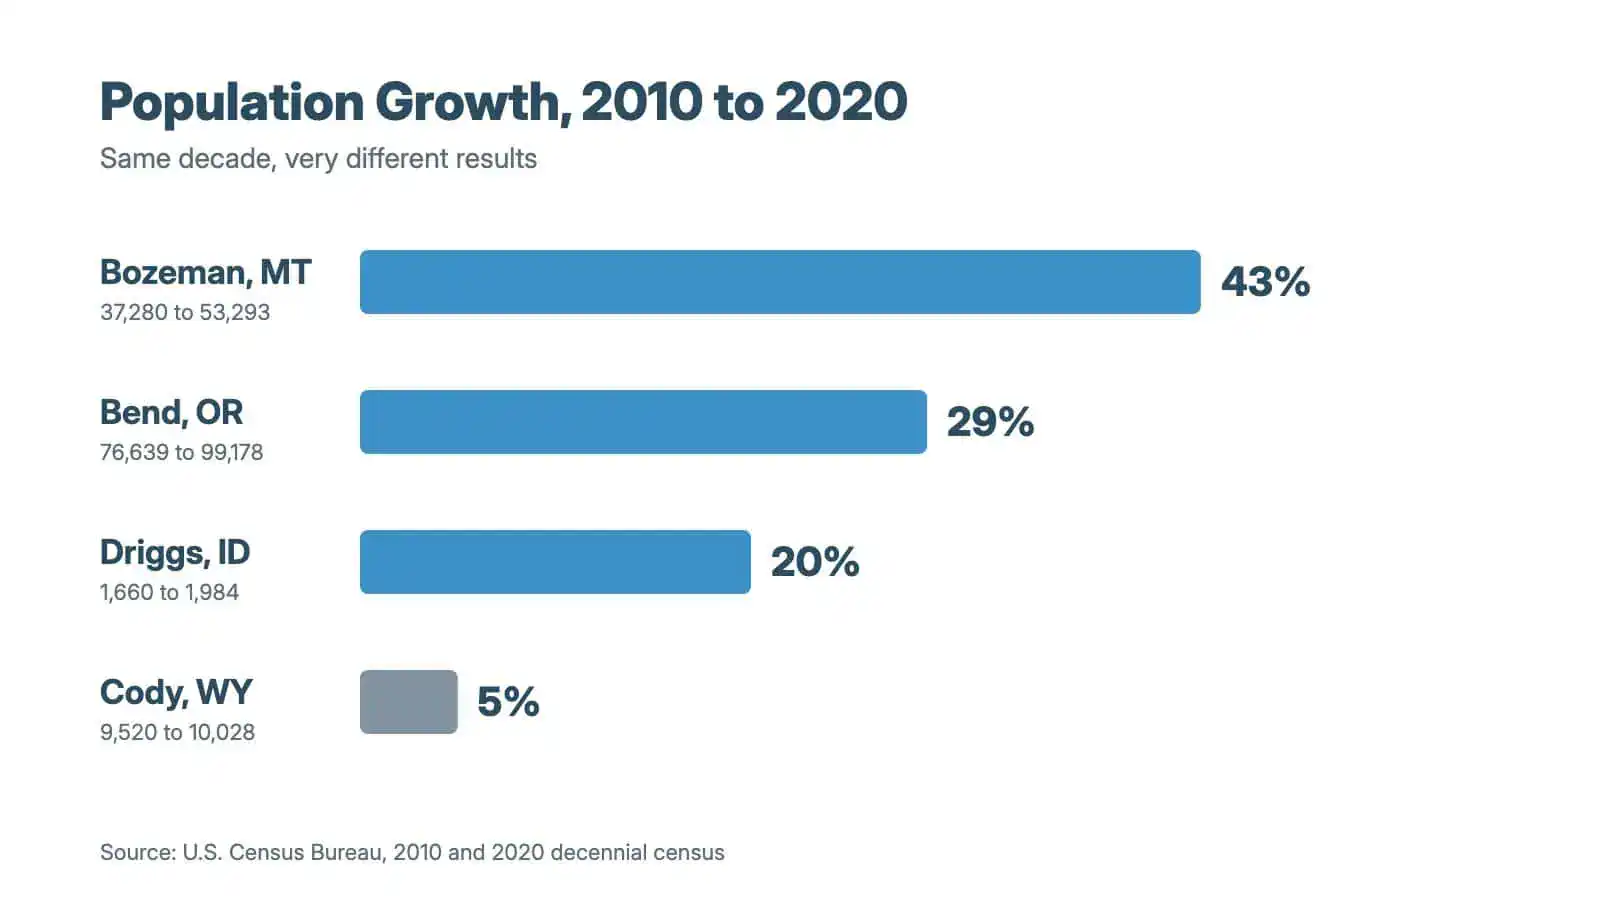
Bend shows what can happen when those same kinds of lifestyle advantages are reinforced by stronger economic drivers, infrastructure, and investment.
Case Study: Bend, Oregon
Bend illustrates what happens when lifestyle amenities and economic drivers reinforce one another. For this article, I spoke with my uncle, Rick Wright, an architect and longtime Bend property owner who moved to the city in 1979. His perspective matters because he arrived before Bend looked anything like the growth story investors recognize today.
When Wright arrived, Bend was still deeply tied to the timber industry. As logging declined through the 1980s, the local economy struggled to replace what had long been its foundation. “Bend had a pretty rough go transitioning from a timber town to a tourist town,” he recalled. He remembers the mid-1980s real estate market was so depressed that it took roughly two years to sell his previous house, while downtown Bend struggled with widespread vacancy.
The mountains, river, forests, and outdoor access had always been there. What changed was their economic importance. Mount Bachelor became a larger tourism draw, while skiing, rafting, fishing, hunting, hiking, and other outdoor activities attracted visitors and, eventually, people looking to relocate. “I’ve got to say tourism was the driving force for the recovery,” Wright said.
Private investment also began changing the physical city. Developer Don Bauhofer and a partner acquired Bend’s former downtown post office in 1984 and converted it into office space. Wright remembers Bauhofer buying struggling downtown properties, investing in them, and making them leasable again. A decade later, developer Bill Smith and six other investors acquired 270 acres of former mill property along the Deschutes River. That site ultimately became the Old Mill District, transforming an abandoned industrial area into a mixed-use destination with retail, restaurants, trails, river access, and an amphitheater.
These projects did more than respond to growth. They helped make Bend a more attractive and functional place to live, work, and visit. Bend also entered this transition with important foundations already in place. Central Oregon Community College’s Bend campus had opened in 1964, and the current St. Charles Medical Center campus opened in 1975. As tourism and in-migration expanded, education, healthcare, transportation, and professional services grew alongside them.
Wright saw the shift firsthand through his architecture practice. His clients increasingly included newcomers choosing Bend for the lifestyle it offered, and as wealth flowed into the market, expectations for homes became more ambitious. He recalls clients who had traveled throughout the western United States looking for a place to settle and ultimately chose Bend.
By 2010, Bend had 76,639 residents. The 2020 Census counted 99,178, a 29% increase in a decade. Decades of tourism, redevelopment, institutions, infrastructure, and in-migration had been changing the city.
That is why Bend is such a useful example. The recreation was always there. Lifestyle did not create the growth story by itself. It accelerated it once the other pieces were in place.
Layer Four: Catalysts
Infrastructure makes growth possible. Economic drivers create demand. Lifestyle makes a place more desirable. Catalysts can speed the whole process up.
A catalyst might be a major employer, energy project, airport expansion, infrastructure investment, resort, or large private development. Investors are drawn to them because they offer a glimpse of what a market could become. But a catalyst is not a guarantee. The strongest ones usually build on a market that already has some of the other layers working in its favor.
Case Study: Kemmerer, Wyoming
Kemmerer is almost the opposite of a market like Bozeman: the catalyst is the story. TerraPower’s Natrium project received its federal construction permit and moved into construction in 2026, creating a real source of potential jobs, investment, and infrastructure activity.
That makes the market worth watching, but it also makes the thesis more concentrated. If one project is doing most of the work in your growth story, I would be more conservative about everything else.
Case Study: Ennis, Montana
Ennis shows why catalysts are interesting and risky. The town has had world-class fishing, hunting, open space, and scenery for decades. What has changed is the amount of attention on what could happen next.
One thesis is continued spillover from Big Sky as housing costs rise and workforce shortages push demand outward. Some local investors also watch the private Jack Creek Road corridor between Big Sky and Ennis and wonder whether broader access could ever better connect the two markets. That is speculation, not a prediction.
That is the point. Catalysts can create opportunity before the demographic data moves, but you are underwriting something that may never happen. The earlier you are, the more important it is to separate what is real from what you hope will become real.
A Final Thought on Catalysts
Catalysts get attention because they are easy to tell stories about. I care more about what they land on. A major project can accelerate a market with solid infrastructure and real demand; it cannot automatically fix a weak foundation.
Why Some Towns Never Break Out
One of the easiest mistakes in rural investing is assuming growth is inevitable. A town has cheap land, a nearby city is booming, or a big development has been announced, and the story starts to write itself.
But potential is not demand. Having room to build isn’t the same as having people who want to live there, and proximity to growth isn’t the same as capturing it.
Case Study: Three Forks, Montana
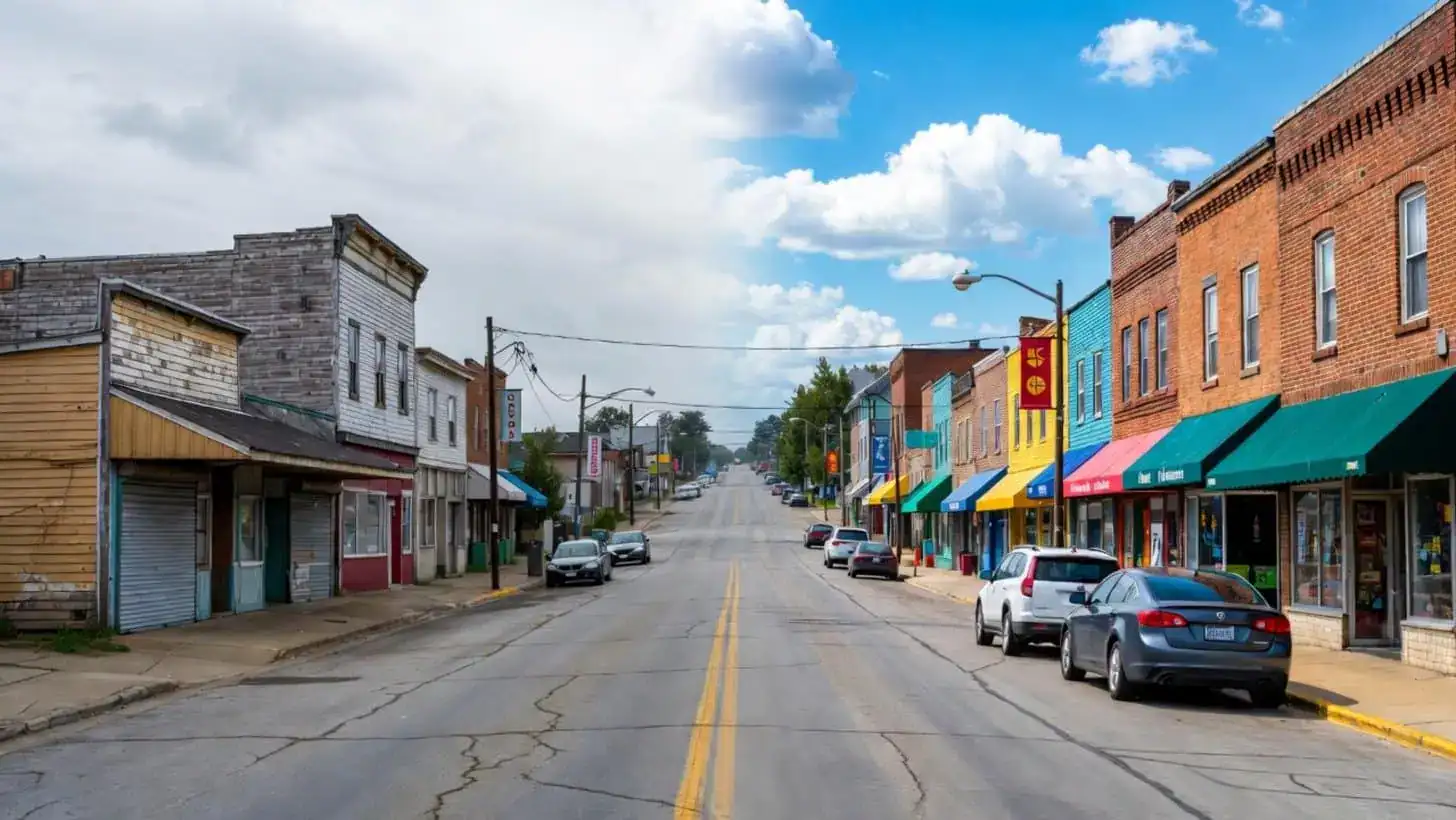
Three Forks is a good example. As Bozeman grew and housing got more expensive, the town looked like an obvious path of expansion: cheaper land, plenty of room to build, and access to the broader Gallatin Valley.
Growth happened, but more gradually than many expected. Demand expanded first into places such as Belgrade, Four Corners, Churchill, and Manhattan, where access, services, employment, and convenience were stronger.
Three Forks may still have plenty of upside. The lesson is that having room to grow isn’t the same as becoming the preferred direction of growth.
The Difference Between Opportunity and Probability
Most rural towns have something going for them: land, recreation, affordability, proximity, or a potential catalyst. The best opportunities usually appear when several of those strengths work together.
That is why I would rather understand a market’s full profile than make a bet on one compelling story.
Applying the Framework
The point of the framework is not to create a magic score. I use the 1-to-5 ratings to force myself to look at each layer separately and see what kind of market I am actually dealing with.
I would not add the four scores together. A market with great lifestyle and weak economics is a very different bet from one with strong employers and infrastructure but fewer lifestyle advantages, even if the totals happen to match.
How a Land Investor Can Use the Framework
For land investors, the framework is most useful one step before parcel-level due diligence. Before I spend much time on a property, I want to understand whether the surrounding county or town will attract more buyers over the next several years.

The question is not simply, “Is this already a hot market?” By then, a lot of the easy upside may already be priced in. I am more interested in what is changing that could create a larger buyer pool for land than exists today. New roads or interchanges, utility extensions, sewer expansions, broadband, employer growth, hospital or school expansion, rising tourism, spillover from a more expensive neighboring market, or a major private project can all be signals worth investigating. None of them guarantees land values will rise, but together they can show where demand may be building before it is obvious in the sales data.
Much of the research can be done using public sources. I would start with the city or county comprehensive plan, capital-improvement plan, planning commission agendas, zoning maps, and major subdivision applications. Utility master plans, public-works documents, state DOT project maps, and airport capital plans can show where infrastructure is being expanded or where capacity is becoming a constraint.
Local newspapers and other local publications can also help you spot proposed projects, business expansions, and development activity, but I wouldn’t rely on them alone. Some of the best information comes from calling the planning department, public works office, utility provider, or other local agency and asking questions. Staff often have useful context about where applications are coming in, which areas are creating headaches, where utility capacity is tight, or what changes are being discussed that may not be obvious from a map or website.
For economic drivers and catalysts, I would also look at major employers, healthcare and education systems, local economic-development groups, state labor data, and actual project filings rather than rely only on announcements. For lifestyle and spillover, I would pay attention to where buyers are being pushed as nearby markets get more expensive and whether the cheaper market still has practical access to the jobs, services, or recreation creating that demand.
Only after a market passes that screen would I move to the parcel itself: legal access, zoning, water, soils, floodplain, utilities, holding costs, and who the eventual buyer is. The Rural Growth Pyramid helps answer, “Which counties or towns deserve my attention?” Traditional land due diligence answers the next question: “Is this particular parcel worth buying?”
Understanding the Scale
| Score | Description |
|---|---|
| 1 | Significant weakness or constraint |
| 2 | Below average |
| 3 | Adequate or neutral |
| 4 | Strong |
| 5 | Exceptional competitive advantage |
Infrastructure
Question: Can people, goods, and businesses easily access and operate within the market?
| Score | Characteristics |
|---|---|
| 1 | Significant access or utility limitations; infrastructure actively constrains growth |
| 3 | Functional infrastructure with some limitations |
| 5 | Excellent transportation access, utility capacity, and room for expansion |
Questions to ask:
- How do people get here?
- Is there interstate or major highway access?
- How far is the nearest commercial airport?
- Are water and sewer systems capable of supporting growth?
- Is reliable fiber internet available?
- Are there known infrastructure bottlenecks?
Economic Drivers
Question: What creates jobs, income, and economic activity?
| Score | Characteristics |
|---|---|
| 1 | Limited economic activity or dependence on a single employer or industry |
| 3 | Several stable industries but limited diversification |
| 5 | Multiple independent economic drivers creating durable demand |
Questions to ask:
- What industries drive employment?
- Is employment diversified?
- Does the community attract activity from surrounding areas?
- Is it a healthcare, education, government, or commercial hub?
- Would the local economy remain healthy if one major employer disappeared?
Lifestyle Multipliers
Question: Why would someone choose to live here instead of somewhere else?
| Score | Characteristics |
|---|---|
| 1 | Few distinguishing lifestyle advantages |
| 3 | Moderate recreational or quality-of-life appeal |
| 5 | Destination-quality amenities and a strong community identity |
Questions to ask:
- What recreational opportunities exist?
- Does the community have a unique sense of place?
- What attracts visitors?
- What attracts residents?
- Would people choose to live here even if housing costs increased?
Catalysts
Question: What is changing right now?
| Score | Characteristics |
|---|---|
| 1 | No meaningful catalyst visible |
| 3 | Potential catalyst exists but impact remains uncertain |
| 5 | Significant catalyst already underway with measurable effects |
Questions to ask:
- Are major employers expanding?
- Are infrastructure projects underway?
- Is private capital flowing into the region?
- Is nearby growth creating spillover demand?
- What assumptions must be true for the catalyst to succeed?
Building a Market Profile
Rather than calculating a total score, consider how the layers interact. For example:
| Category | Score |
|---|---|
| Infrastructure | 4 |
| Economic Drivers | 2 |
| Lifestyle Multipliers | 5 |
| Catalysts | 3 |
This profile tells a story. The market is attractive and accessible, but its economic foundation may be weaker than its lifestyle appeal suggests. A different market with strong economic drivers and infrastructure but fewer lifestyle advantages may offer a very different investment opportunity despite a similar overall score.
The most compelling rural growth markets tend to emerge when multiple layers reinforce one another. The score is less important than the story it tells. High scores may indicate strong fundamentals, but investment opportunities often emerge before the market fully recognizes those strengths. Investors are rewarded for correctly identifying strengths, weaknesses, opportunities, and risks before the rest of the market does.
Example Market Profiles
To show how the framework applies, the table below provides a simplified assessment of several Mountain West markets discussed throughout this article. The scores are subjective and show how different combinations of strengths and weaknesses create different investment profiles.
| Market | Infrastructure | Economic Drivers | Lifestyle | Catalysts |
|---|---|---|---|---|
| Bozeman, MT | 5 | 5 | 5 | 4 |
| Livingston, MT | 4 | 3 | 4 | 2 |
| Three Forks, MT | 3 | 2 | 3 | 3 |
| Ennis, MT | 2 | 2 | 5 | 4 |
| Kemmerer, WY | 2 | 2 | 2 | 5 |
| Cody, WY | 3 | 3 | 5 | 2 |
The value of the framework is not the individual scores. It is understanding why each market received them.
Bozeman scores highly across nearly every category. It benefits from transportation infrastructure, a diversified economy, strong lifestyle amenities, and decades of reinforcing growth drivers.
Livingston possesses many strengths, including interstate access, recreation, and proximity to Bozeman. However, infrastructure constraints and accessibility challenges have limited its ability to fully capitalize on those advantages.
Three Forks has attracted attention for its affordability, available land, and location within the broader Gallatin Valley. Yet its economic base remains smaller than neighboring communities, and growth has occurred more gradually than many investors anticipated.
Ennis earns a strong lifestyle score for its outdoor recreation, scenery, and quality of life. Its catalyst score reflects ongoing speculation surrounding Big Sky’s continued growth and the possibility that future connectivity improvements could strengthen the relationship between the two markets.
Kemmerer demonstrates how a single catalyst can dominate a market profile. TerraPower’s Natrium project has moved into construction, driving significant investor interest despite the community’s fewer advantages in other areas.
Cody illustrates that a community can possess exceptional lifestyle amenities without becoming a high-growth market. Tourism, recreation, and proximity to Yellowstone create enduring demand, but transportation and economic constraints influence long-term growth potential.
Conclusion
There is no formula for finding the next Bozeman, Bend, or Jackson. Growth is messy, and it is usually much easier to explain in hindsight. Instead, I look for alignment. Can the market physically support growth? Is there real economic demand? Does it have something that makes people choose it? Is anything changing that could accelerate the trend? No single factor is enough. The goal is not to predict the future perfectly. The goal is to recognize when several forces start to reinforce one another before that story is obvious in population numbers and headlines. You will still be wrong sometimes. But you will be asking better questions, and in small markets that is usually where the opportunity starts.
 Alex Wright is a real estate investor and former Realtor based in Wyoming. He founded DealForge and OppMap, tools that help investors evaluate markets, analyze real estate opportunities, and make better decisions using real-world data and assumptions.