There's a common dilemma I've always had to wrestle with when buying vacant land. The issue boils down to valuation.
Land is a peculiar type of real estate because, in the vast majority of cases, it is EXTREMELY difficult to come up with a rock-solid, 100% reliable “market value” for this type of property (ask a professional real estate appraiser and chances are, they're basically “winging it” in this area because the data just isn't there).
So how are we supposed to have confidence in the value of what we're buying?
I've always maneuvered through this process by following the guidelines in this blog post, which usually points to a reasonably strong conclusion, but if you're looking for an even more quantifiable, measurable approach, I wanted to share with you an EPIC trick I learned about from Karl James, one of our faithful members of the Land Investing Masterclass.

Karl uses Redfin, which provides much of the same information as Zillow, but allows users to download all the sales comp data in a CSV file. This may not seem significant at first glance, but trust me, it opens up all kinds of possibilities when analyzing the numbers and putting this data to work.
Step 1: Search the Market in Redfin
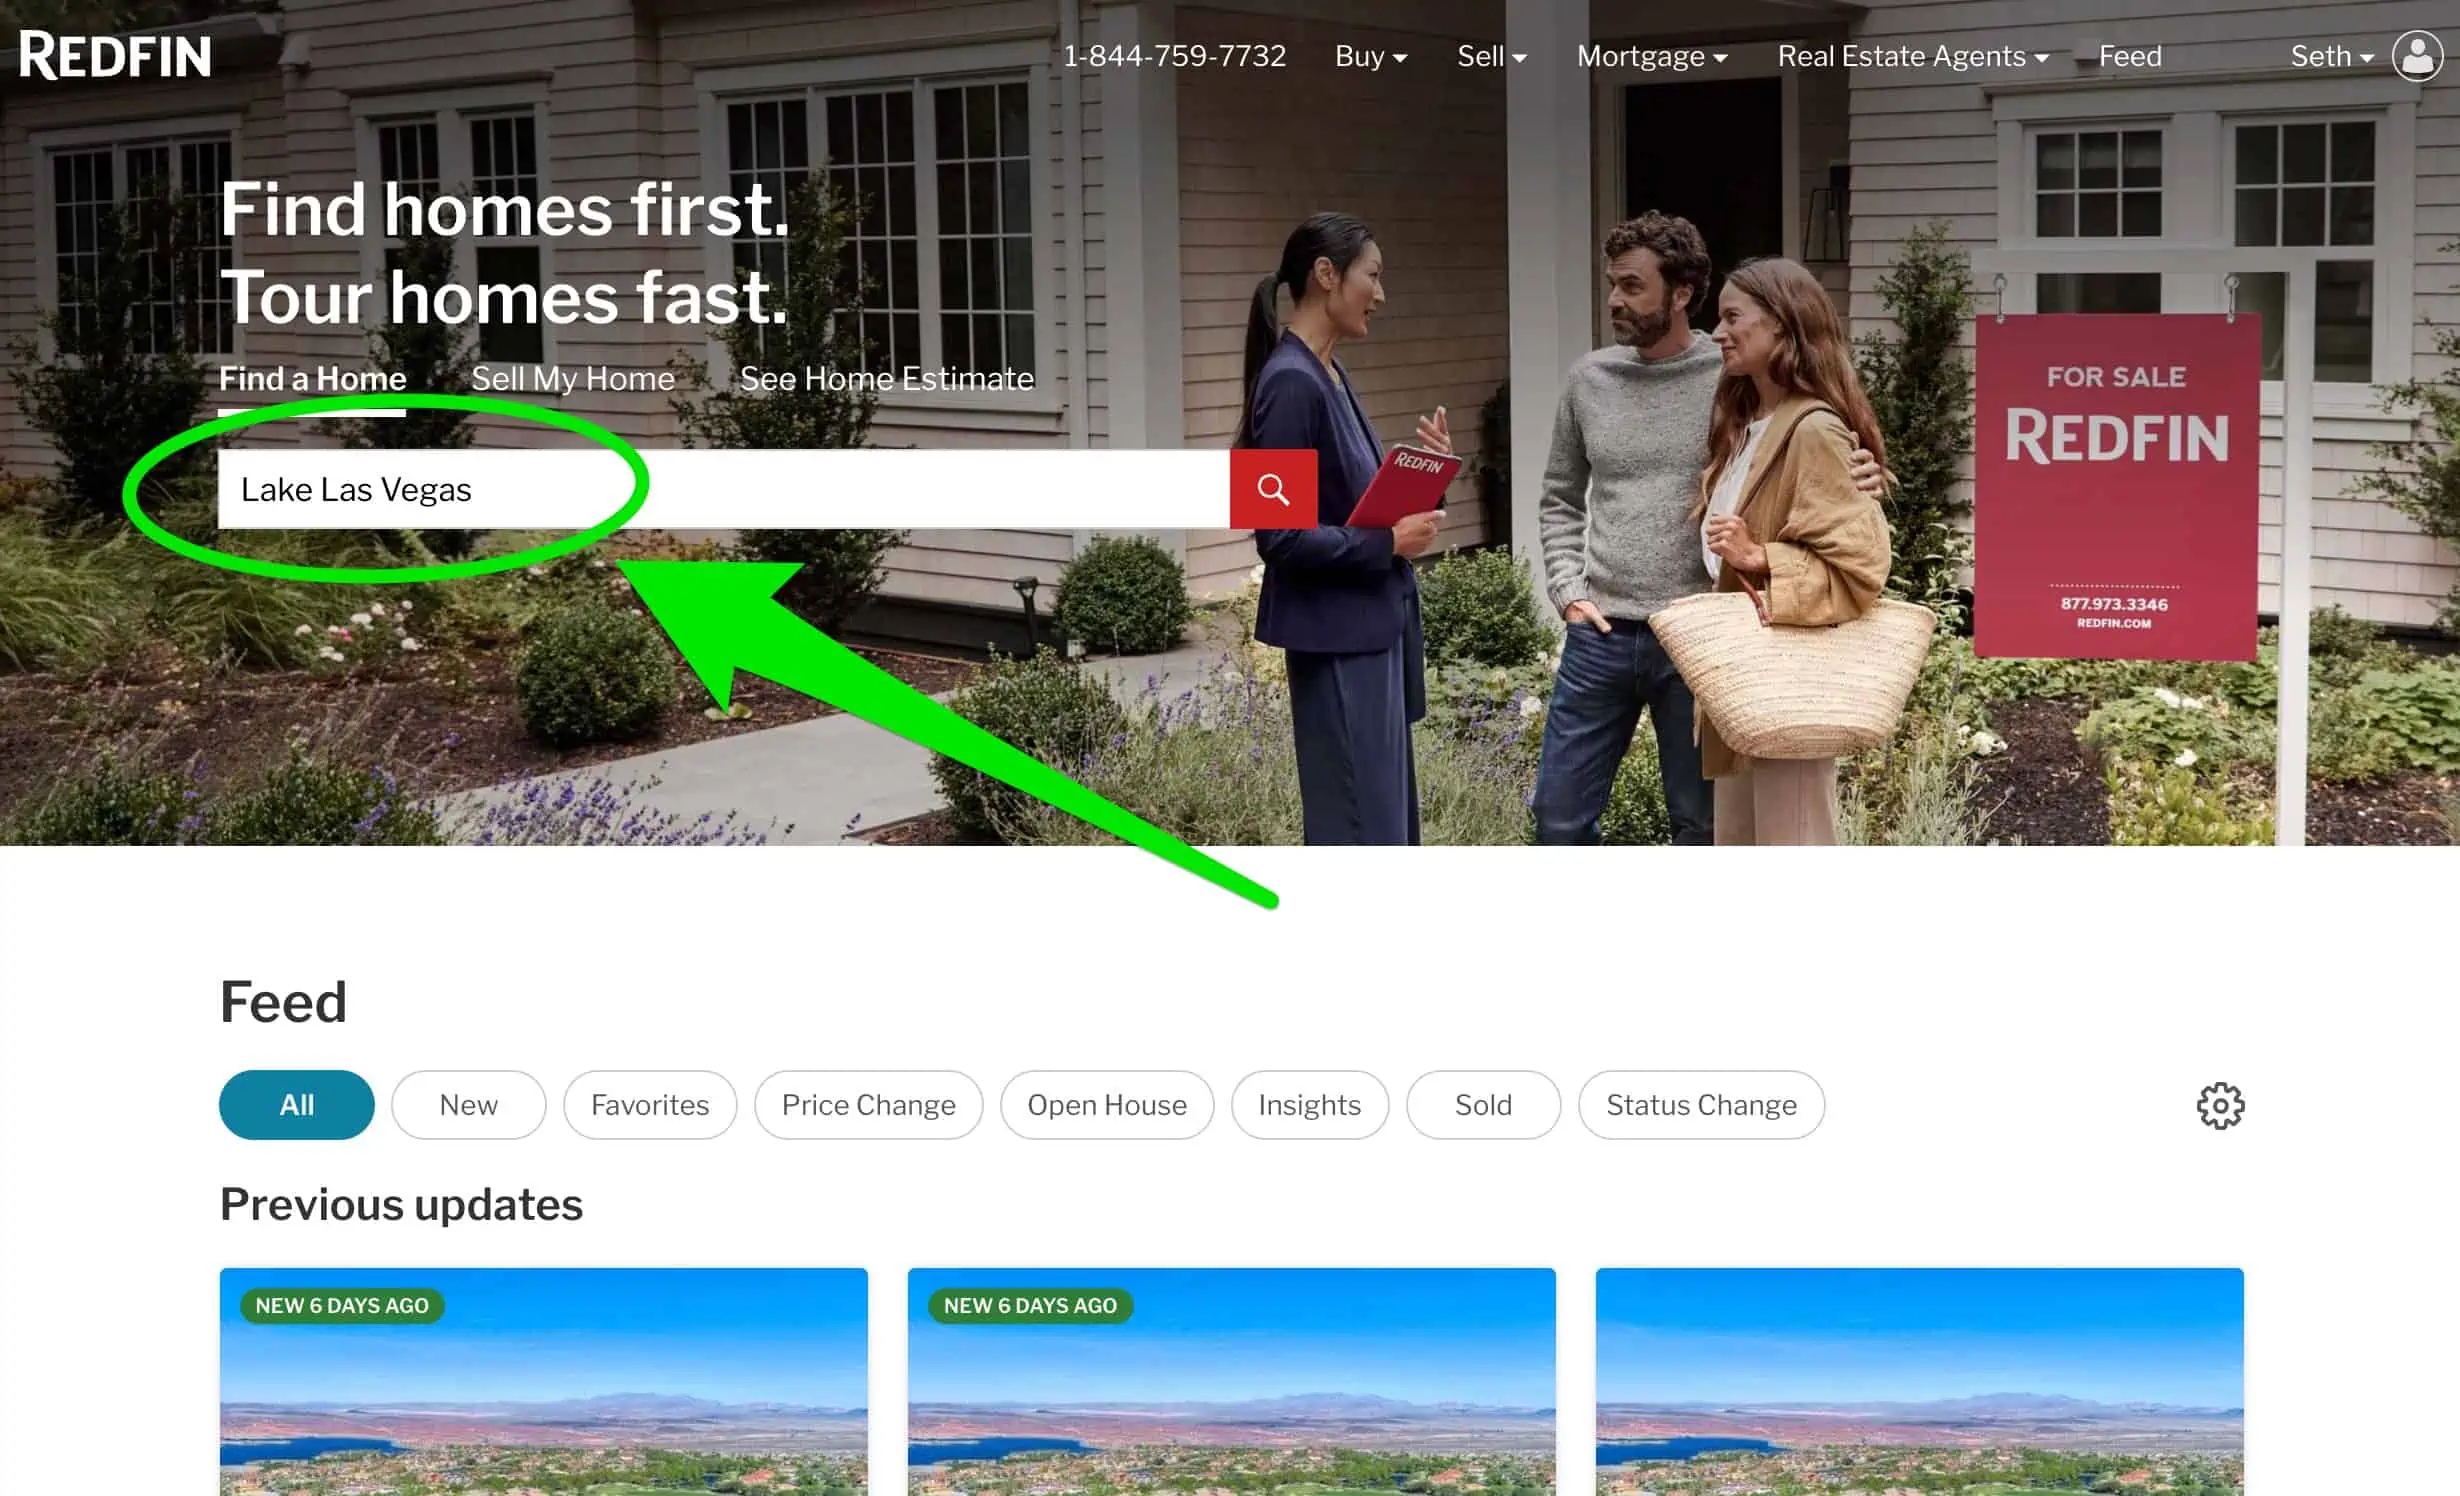
For this example, let's assume we've got a random lead on a vacant lot in the Lake Las Vegas area of Henderson, NV. Let's start by going to Redfin and searching for comparable listings and sales.
In the “Find a Home” dialog box, type: Lake Las Vegas, NV. When Redfin suggests Lake Las Vegas; Henderson, NV in the area below the text box, click on it.
Step 2: Customize Your Search
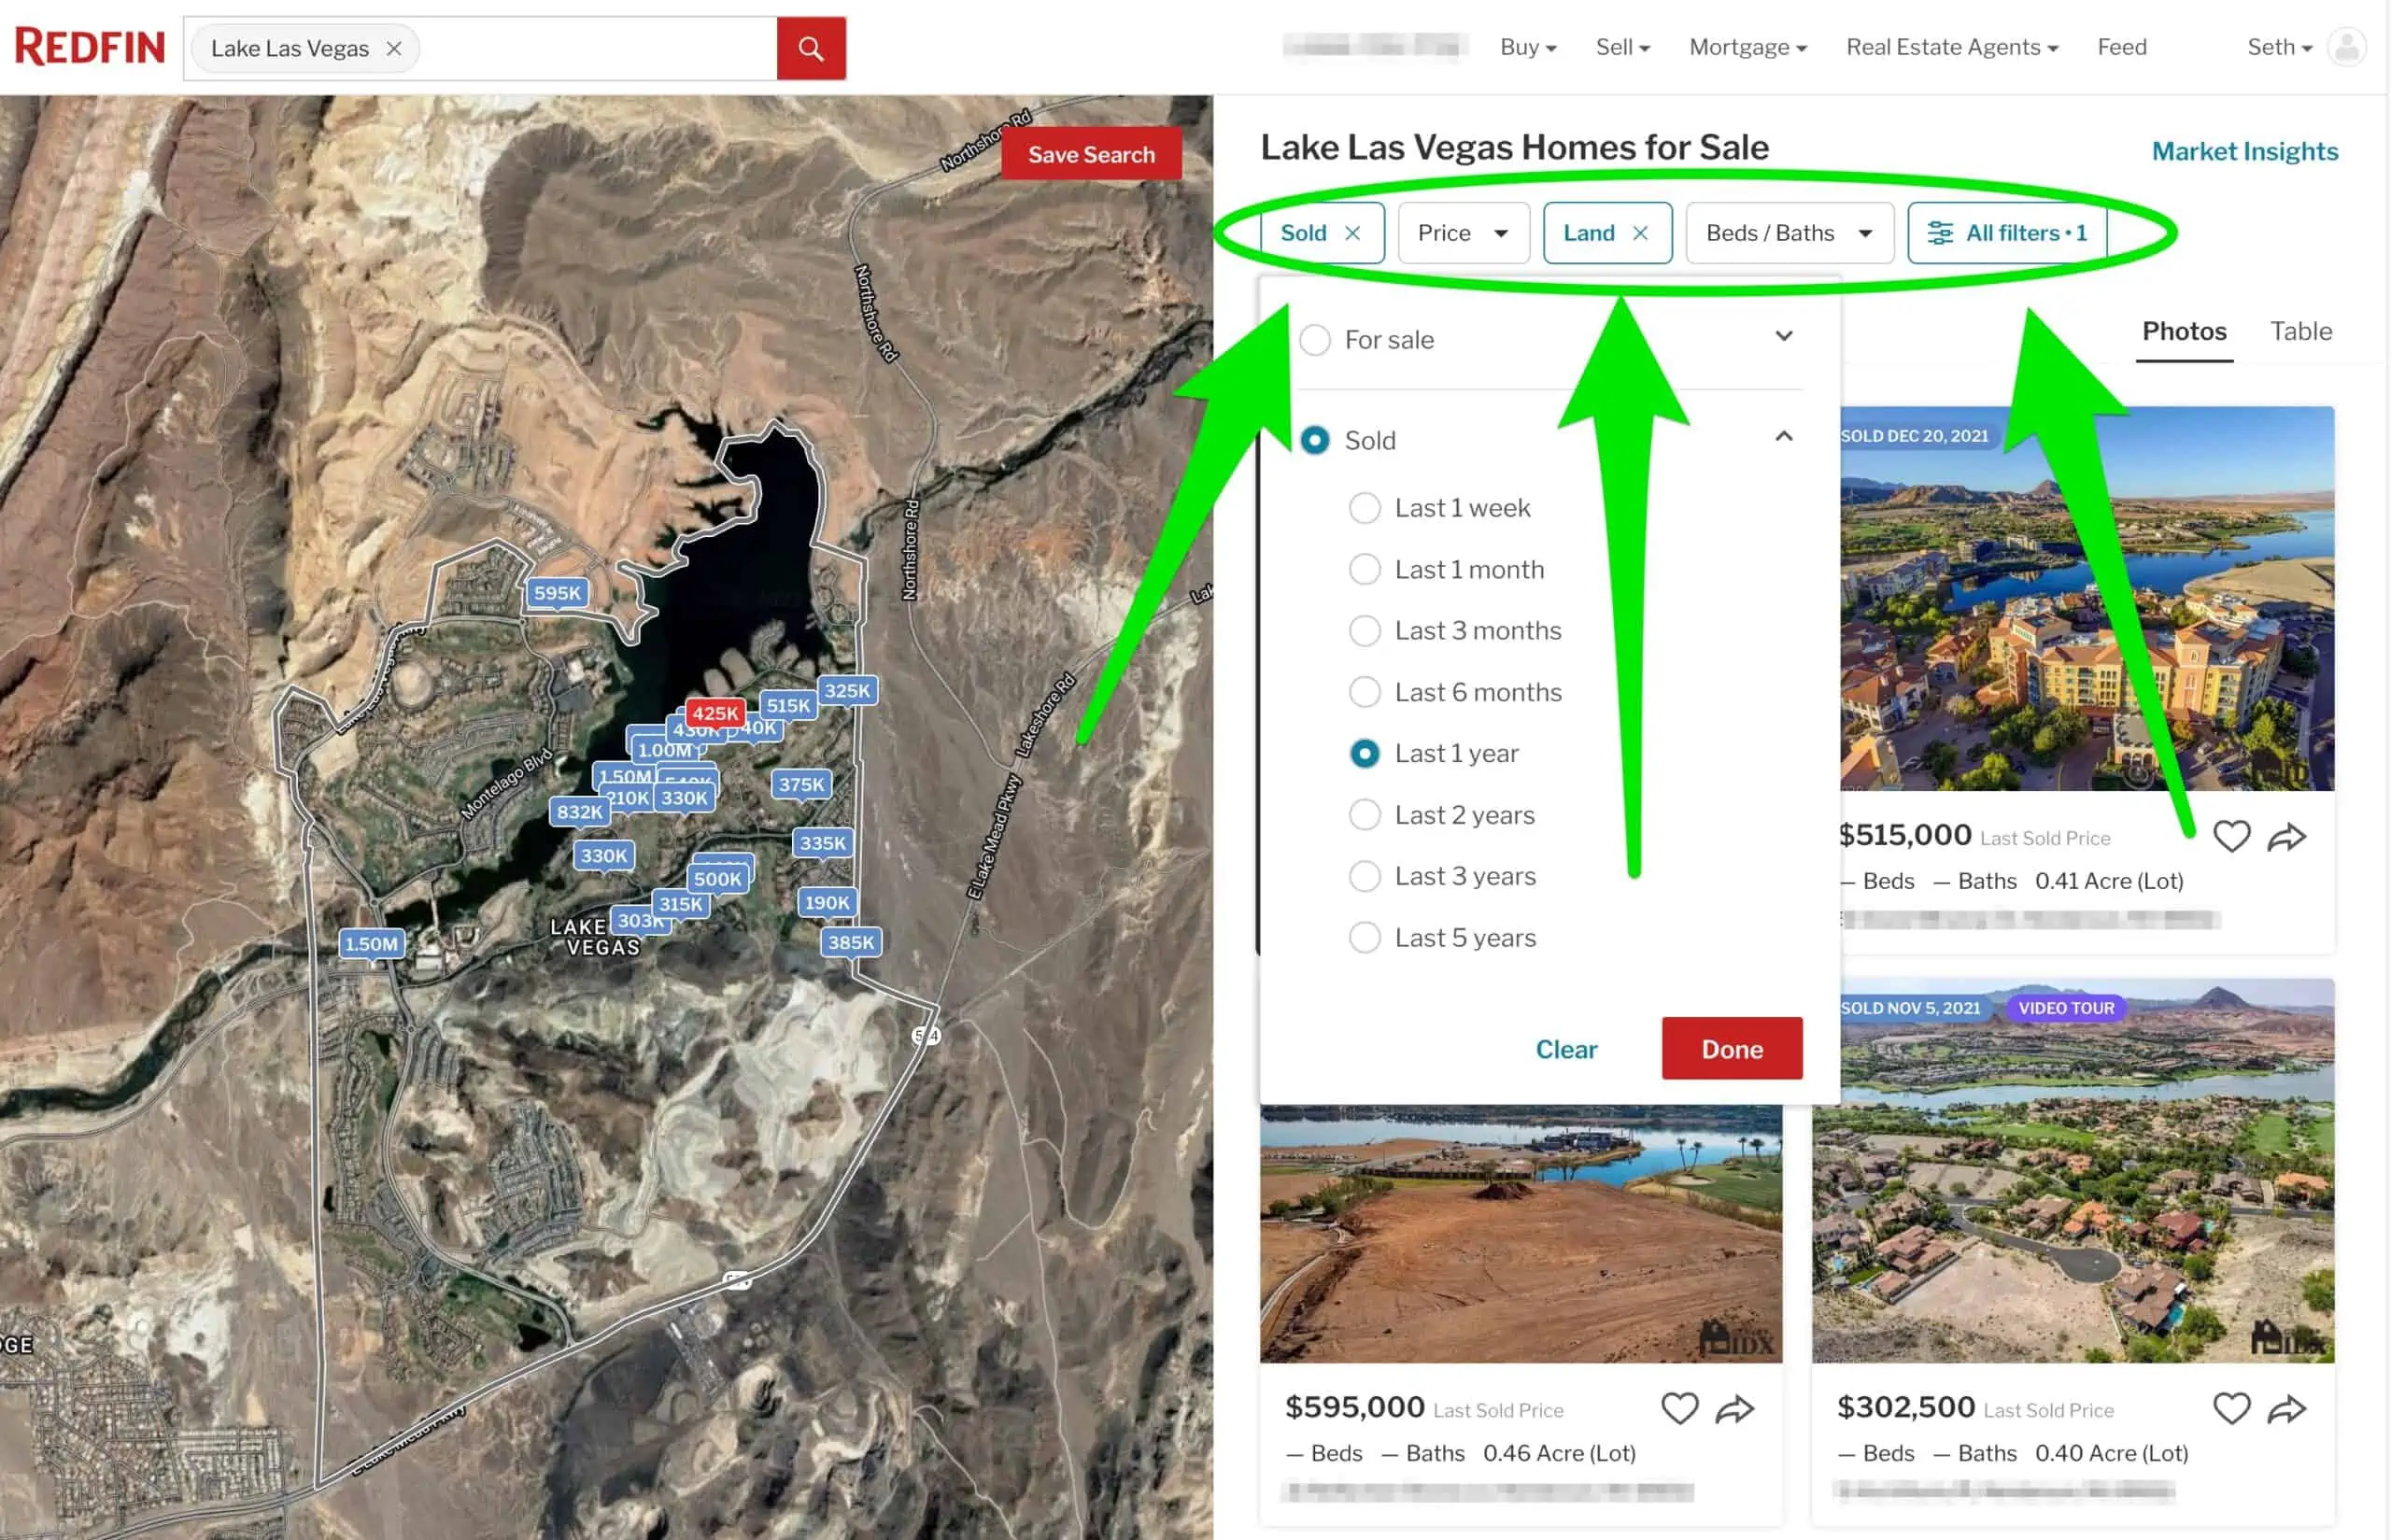
Next, click on the filters button near the top of the screen. Once the Filters dialog box pops up, do this:
- Deselect all of the “Property Type” options other than Land.
- Select dropdown under “For Sale” and change it to “Sold” and set the time period for Sales to “Last 1 Year” from the drop-down list (if using a longer timeframe, it may return too may results, feel free to throttle it back to something less).
- If there are sufficient comps, you can also click “All Filters” and narrow down your search based on a size range (in my example, I filtered them from 0.25 – 5 acres).
Step 3: Export Property Details
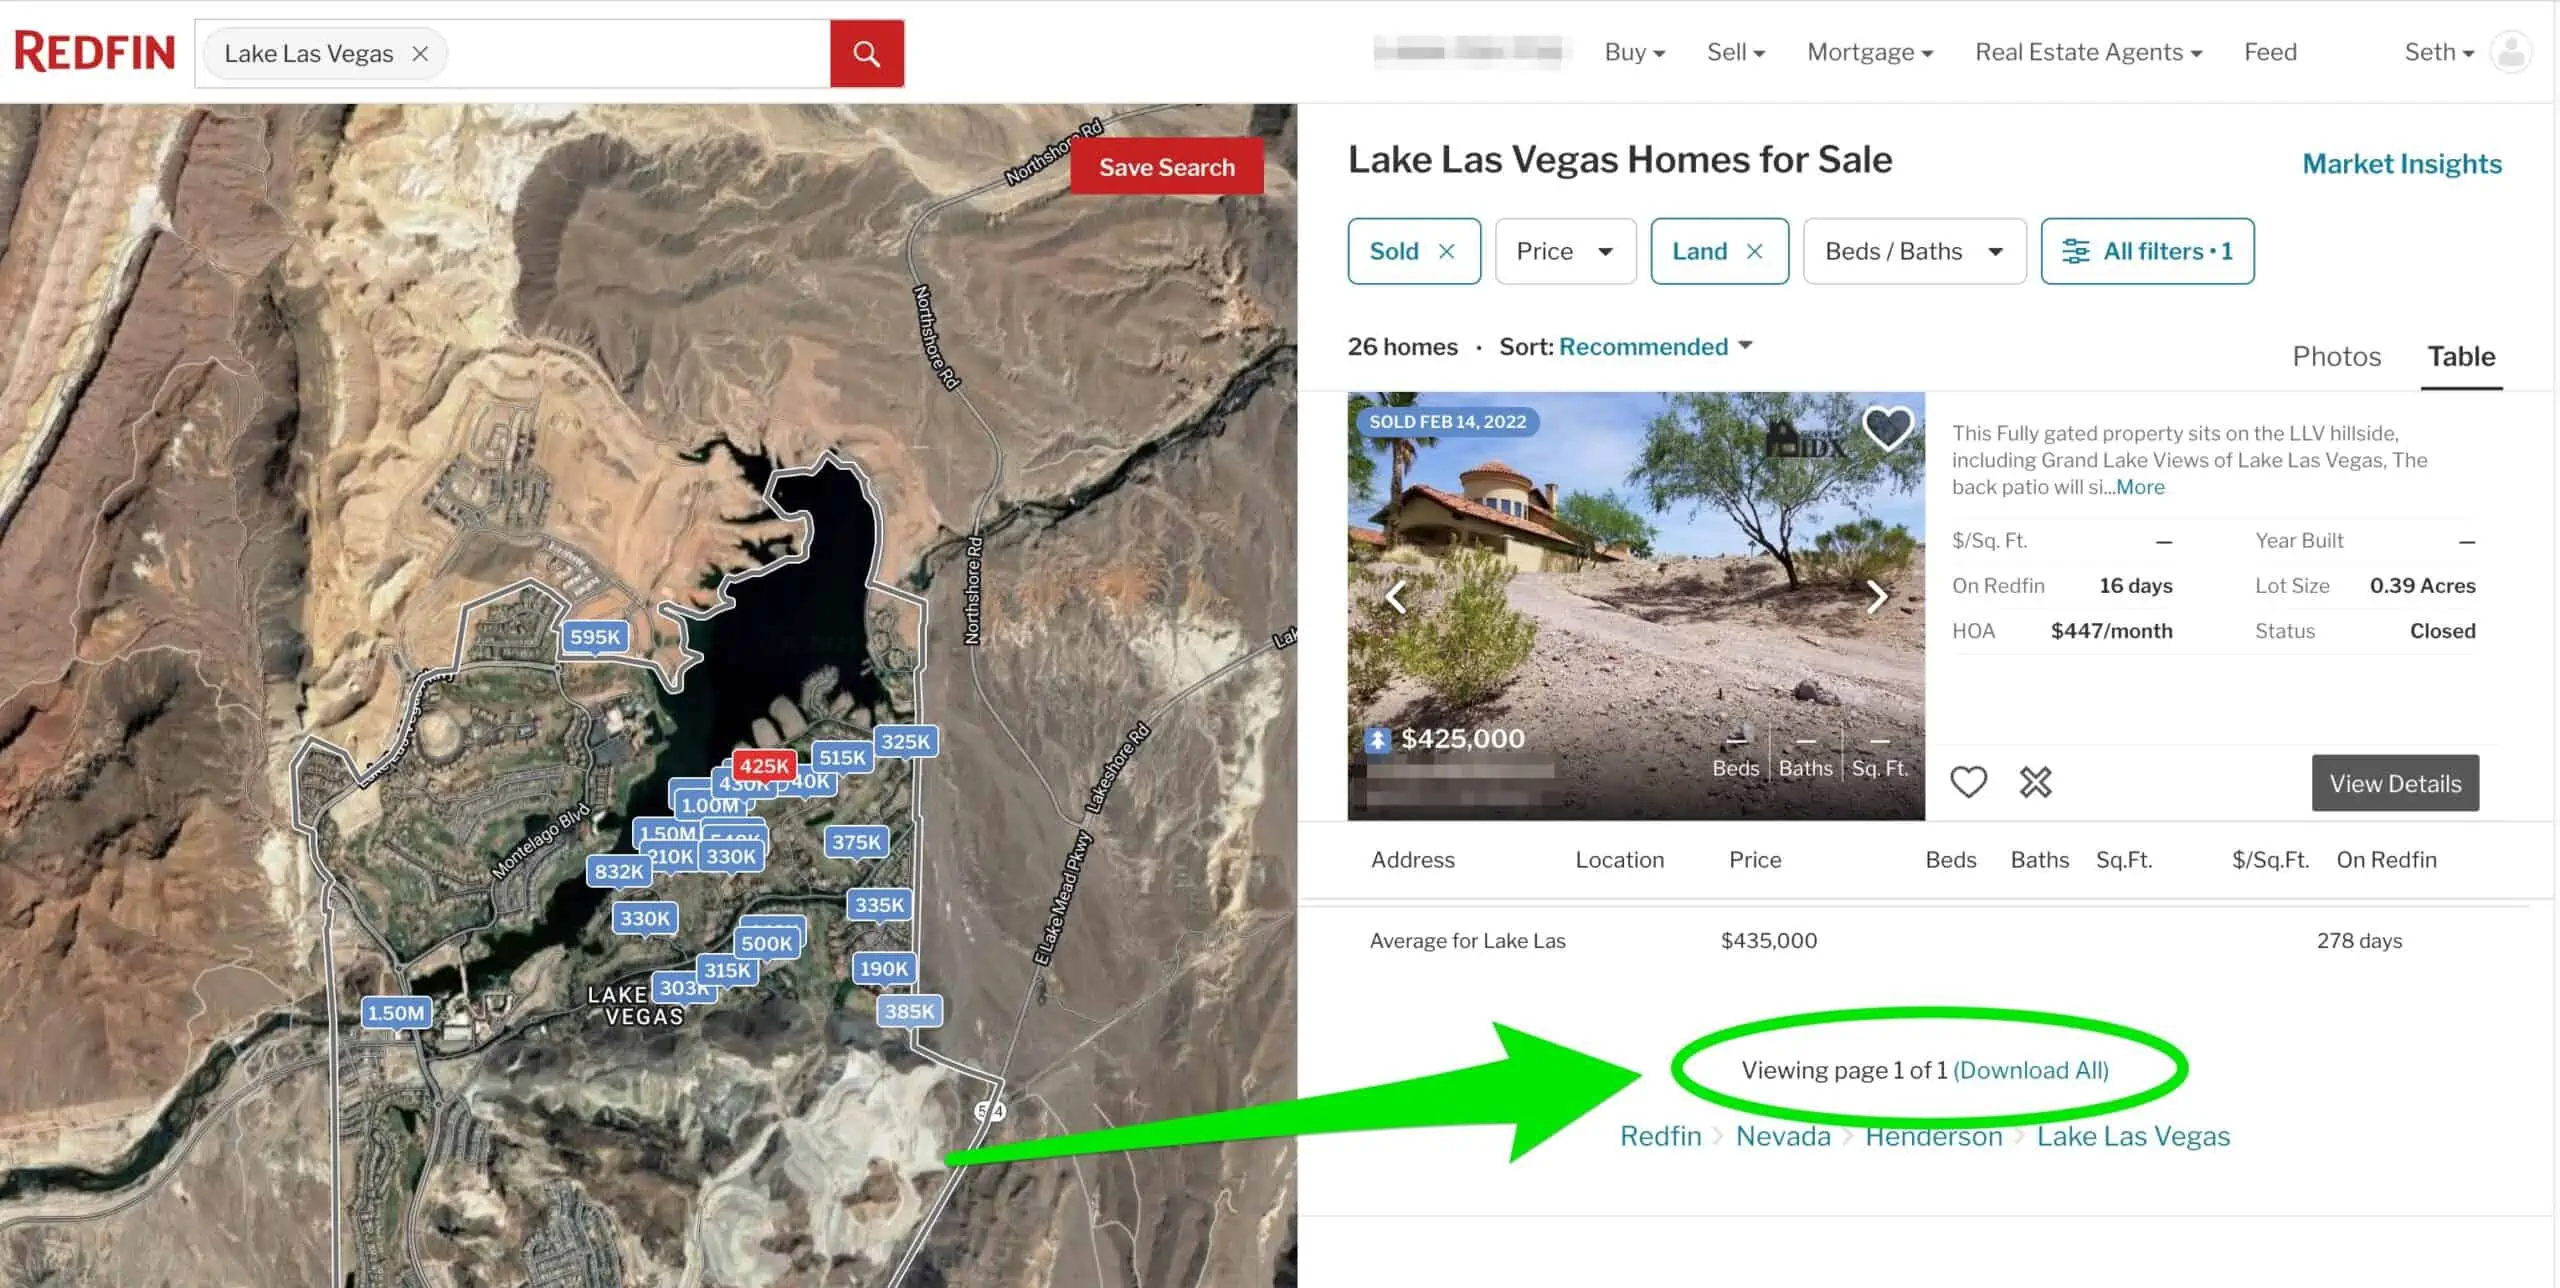
Scroll down to the bottom of the properties list on the right-hand side of the screen.
When you get to the bottom, click on the “Download All” link. This will create a CVS file that can be opened in Excel with sales and listing information.
Step 4: Filter and Organize the Data
When you download your CSV file, it will look something like this…
When you get to the point of downloading the CSV file and making sense of the data, you'll have to make a few edits to the list in Excel (Note: I went through these steps in the video above, starting at 3:32, but I also wanted to lay out the steps to this process below – just to make it easier to follow along):
a) Start by deleting all (vertical) columns except for the following:
- Price
- Lot Size
Also, if you see any (horizontal) rows that have blank fields, delete those rows.
b) Then add two (vertical) columns after the “Lot Size” column and name them as follows:
- Acres
- $ / Acre
c) Add the following calculation into the first field in the “Acres” column:
=C2/43560
Assuming that Column C is showing the “Lot Size” (which is measured in square feet), this formula will take each of the corresponding lot size numbers and convert them to acres (note: 1 acre = 43,560 square feet).
Click and drag this top cell all the way to the bottom of this list, so the same formula applies to every row.
d) Add the following formula into the “$ / Acre” column:
=A2/C2
Assuming that Column A is showing the “Price” and Column C is showing the “Acres“, this formula is telling Excel to divide the last sale price of each property by each property's respective size in acres.
Click and drag this top cell all the way to the bottom of this list, so the same formula applies to every row.
e) Scroll to the bottom of your “$ / Acre” column and enter the following formula:
=AVERAGE(D2:D27)
Note: In this example, “D27” happens to be the last field in my list. You should replace this number with whatever the last field in YOUR list happens to be (see the video above at 5:15 to see what I'm talking about).
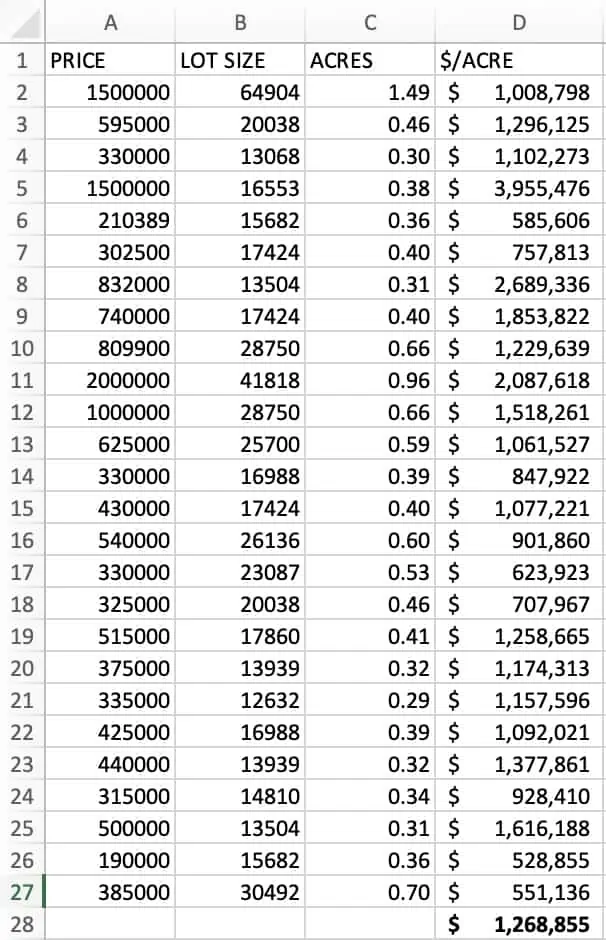
In the end, your reformatted list will look more like this:
What Does This Do For Us?
What exactly do these calculations do for us?
They tell us how many dollars per acre were paid for each property.
Using this information, you can then compare and contrast it to the property you're looking at. If you aren't sure what the value per acre is, these numbers could give you a much better idea of what general range you should be looking at.
Watch Out for This…
Keep in mind, the narrower you make your filtering criteria in Redfin, and the more similar you can keep these comparable properties to the subject property you're evaluating, the more reliable your numbers will be.
If you include every vacant land sale in the entire county going back three years, you will have some WILD variations in value, which will ultimately make your final average a lot less reliable.
Why? Because when you don't use appropriate comparables, you aren't getting an apples-to-apples comparison.
Granted, in some markets, it's very difficult to find true, apples-to-apples comparables… but to the extent that you're able to do this, the more reliable your final number will be.
RELATED: Zillow vs. Redfin: Which Estimator Is More Accurate?
When Redfin Doesn't Work (Data Scraper Alternative)
If you work with Redfin long enough, you'll eventually find that some markets won't let you download the CSV file. And in other markets, Redfin won't work at all.
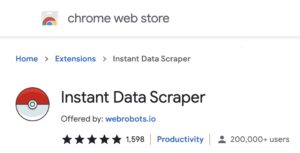
Alternatively, if you find that Redfin simply isn't working at all in your market, you can use LandWatch and follow the same process explained above, and use the instant data scraper chrome extension to accomplish the same purpose. You can see a more detailed explanation at 12:29 in the video above.
RELATED: Who Should Use Redfin?
Don't Forget: This Doesn't Account for Everything
It should go without saying that this isn't a fool-proof method.
With any property, the size and location of the physical attributes of the property itself are of utmost importance (e.g. – a 1-acre property on a beautiful lake is going to be more valuable than a 10-acre property with limited uses next to a landfill).
This approach also doesn't account for a host of other things that can have an effect on a property's market value (take these things for instance).
That being said, if you have no idea where to start and you're not willing to put your trust in the county's assessed value, this is a great way to use some highly relevant, real-world data to gauge a property's approximate market value before you make an offer.
Have fun with it!


