
What Is Cartography?
Shortcuts
- Cartography is the science and art of map-making, representing spatial information visually.
- Modern maps play essential roles across sectors, guiding urban planning, transportation, and real estate decisions.
- Geographic Information Systems (GIS) allow the integration and layering of diverse data sets, from population density to climate patterns, revolutionizing how we visualize spatial information.
- Cartographic tools aid in market analysis, property valuation, site selection, urban planning, and environmental risk assessment in real estate.
- Advanced cartographic technologies, including remote sensing and GPS, provide accurate, real-time spatial data essential for creating and updating maps.
Cartography: An In-depth Overview
Cartography, derived from the Greek words kartēs (map) and graphē (writing), is the intricate process of map-making. It has evolved from maps drawn on clay tablets, such as the “Babylonian Map of the World”[1], to sophisticated digital representations on computer screens.

Historically, cartographers used tools like astrolabes and compasses[2], among others, to draft maps. Today, technology like satellite imaging and Geographic Information Systems (GIS) have revolutionized cartography, ensuring unparalleled precision. GIS, in particular, allows for the layering of information, presenting not just geographical features but also data sets like population density, transportation networks, or climate patterns.
Maps play crucial roles in various sectors. Urban planners rely on detailed city maps to design efficient infrastructure, while environmental scientists employ topographical survey maps to study landforms or water bodies. In transportation, maps guide everything from daily commutes to international flights. Last but not least, real estate utilize cartographic tools and techniques in many applications, such as plat mapping, zoning, and others.
One pivotal aspect of modern cartography is its interactivity. Digital maps can be updated in real time, reflecting changes like road closures or natural disasters. Moreover, with the rise of augmented reality and virtual reality, the potential for immersive map-based experiences[3] is burgeoning.
The above is an example of an interactive map on REtipster, showing which are Tax Deed vs. Tax Lien states. (Full article: A Crash Course in Tax Lien & Deed Investing (and My Love/Hate Relationship With Both)
Applications of Cartography in Real Estate
Cartography is crucial in real estate by providing visual representations of data that help real estate professionals understand the spatial relationships, patterns, and trends within a given market.
- Market analysis: Cartography can map real estate market trends, such as property prices, rental rates, vacancy rates, and demographic data. For instance, the “Big Three” of Zillow, Trulia, and Realtor.com (and Redfin)[4] use map information to identify potential investment opportunities, assess market demand, and understand the competitive landscape.
- Property valuation: Cartographic techniques are used to create thematic maps that display property values based on location, allowing appraisers and valuers to determine the worth of a property. These maps can also show the appreciation or depreciation of property values over time.
- Site selection: Cartography assists in site selection by mapping various factors that impact the suitability of a location for specific purposes. This includes mapping infrastructure, transportation networks, zoning regulations, environmental factors, and proximity to amenities. Real estate developers and businesses can use these maps to identify optimal locations for development or expansion.
- Urban planning: Cartography helps urban planners visualize and analyze land use patterns, population densities, transportation networks, and infrastructure requirements. This information is crucial in making informed decisions about zoning, city development, and resource allocation[5].
- Environmental analysis: Cartographic techniques can map and analyze environmental factors like flood zones, protected areas, soil types, and topography. This information is valuable for assessing real estate development projects’ feasibility and potential risks.
Techniques and Tools Used in Cartography
The tools and technologies used in cartography have transformed the way maps are created, analyzed, and presented.
Geographic Information Systems (GIS)
Geographic Information Systems capture, store, manipulate, analyze, and present spatial or geographic data. GIS software allows cartographers to create, edit, and visualize maps by integrating different data layers, such as satellite imagery, topography, population density, and infrastructure. GIS enables cartographers to perform complex spatial analysis and create customized maps based on specific demands.
GIS software, such as ArcGIS by Esri, QGIS, and MapInfo, provides a range of features, including data visualization, editing, geocoding, georeferencing, and geospatial analysis. These tools have revolutionized cartography by enhancing its accuracy, efficiency, and versatility.
Remote Sensing
Remote sensing involves collecting data about the Earth’s surface without direct physical contact. It employs satellite imagery, aerial photography, and similar technologies, which software then translates to accurate and up-to-date maps for real estate purposes. Professionals can use this data to interpret land cover mapping and urban growth and simulate environmental conditions.
Tools like Landsat, Sentinel, and Google Earth provide access to a vast repository of satellite imagery and remote sensing data, enabling cartographers to incorporate real-world information into their maps.
Global Positioning System (GPS)
The Global Positioning System (GPS) is a satellite-based navigation system that allows cartographers to determine the precise location of various features on the Earth’s surface. The U.S. operates a constellation of 31 GPS satellites[6]. Russia, the European Union, and China operate their own satellite navigation systems—GLONASS, Galileo, and BeiDou, respectively—which, along with GPS, form the core constellations of the Global Navigation Satellite System (GNSS).
GPS receivers receive signals from multiple satellites and use a technique called trilateration[7] to calculate the coordinates of a specific point to within 7 meters 95% of the time. This technology has greatly improved the accuracy and efficiency of mapmaking.
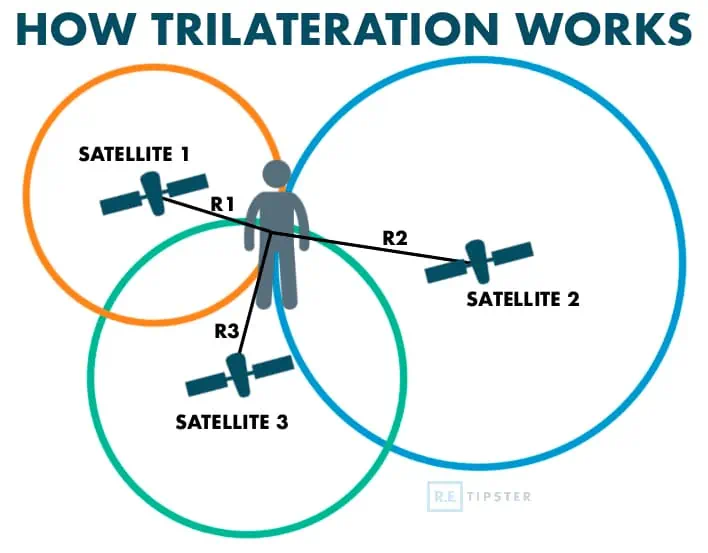
Trilateration works by determining your location from your distance to at least three known points. These points are usually GPS satellites.
GPS is widely used in field surveys to collect spatial data, such as the coordinates of landmarks, boundaries, and points of interest. By integrating GPS data into GIS software, cartographers can accurately position features on a map and create georeferenced datasets.
GPS devices like Garmin, Trimble, and handheld GPS receivers have become essential tools for cartographers working in the field, enabling them to collect accurate spatial data for mapping purposes.
Computer-Aided Design (CAD) Software
Computer-aided design (CAD) software is a cartographic mainstay, which allows cartographers to create, edit, and design maps. CAD software provides a range of tools and features that allow cartographic professionals to draw, label, and symbolize map elements with precision and ease. These tools offer advanced capabilities for creating complex and detailed maps.
CAD software can create vector-based maps[8], which offer scalability and flexibility for printing and digital rendering. Many CAD engines also support the creation of 3D maps, allowing for a more immersive and realistic representation of the Earth’s surface.

Popular CAD software used in cartography includes AutoCAD, Adobe Illustrator, and CorelDRAW. These tools provide a wide range of drawing and editing tools and the ability to import and export data in various formats, making them indispensable for modern cartography.
Challenges and Limitations of Real Estate Cartography
While cartography is an invaluable tool in the real estate industry, it does come with certain challenges and limitations. Some of these include:
- Accuracy and availability: The accuracy and availability of data can vary significantly, making it challenging to create precise and up-to-date maps. Obtaining accurate and reliable data sources can be time-consuming and costly.
- Interpretation: Interpreting and analyzing cartographic data requires expertise and domain knowledge. Misinterpretation of data can lead to incorrect conclusions and decisions.
- Scale and generalization: Maps must be scaled and generalized to represent large areas or specific features[9]. This process can result in the loss of detailed information or distortions in the representation of geographic features, particularly elevation.
- Technical limitations: The use of advanced cartographic techniques and tools may require significant investments in technology and training. Small-scale real estate professionals or organizations may find it challenging to adopt these technologies.
- Dynamic nature of real estate: Real estate markets are dynamic and constantly changing. Cartographic representations need to be regularly updated to reflect these changes accurately.
Frequently Asked Questions: Cartography
How do cartographic maps highlight real estate environmental concerns?
Cartographic maps present an overview of natural features like water bodies, floodplains, and vegetation cover. They can highlight areas prone to flooding, landslides, or other natural hazards. This aids buyers and developers in assessing the environmental risks associated with a property.
Such maps also help in understanding the environmental impact of a potential development. For example, the Environmental Protection Agency released a unified and recognizable cartographic guideline that uses a universal map design, making cartographic data accessible to everyone[10]. This can help developers and investors plan for sustainability and ensure their compliance with environmental regulations.
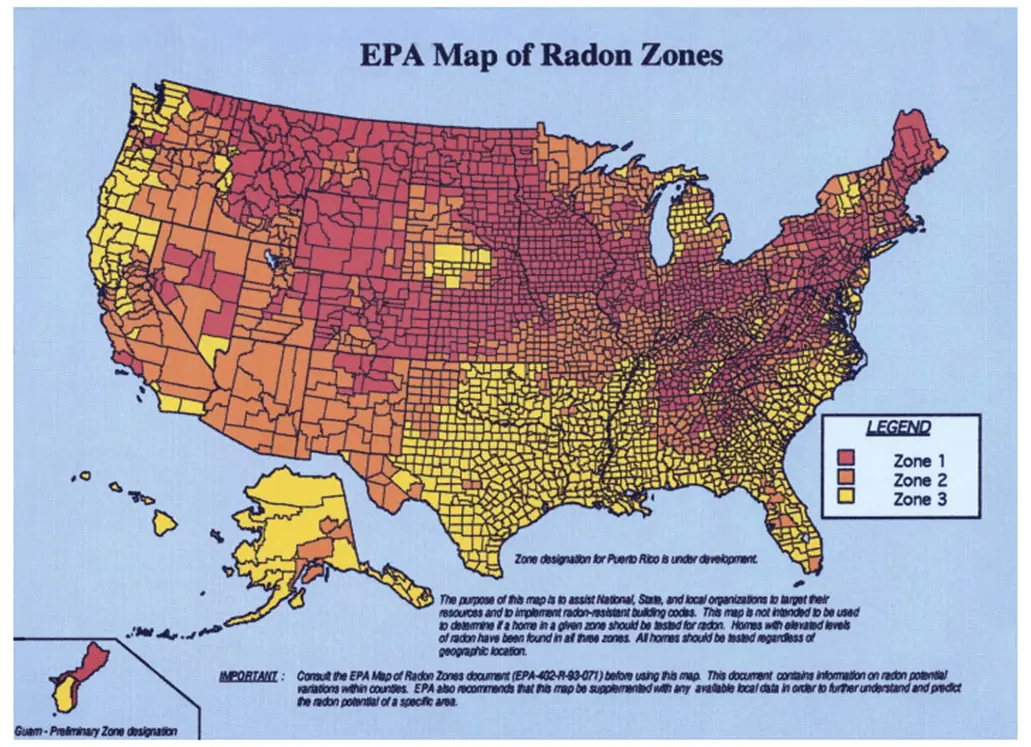
EPA, Public domain, via Wikimedia Commons
Can cartography predict real estate price trends?
Not necessarily. However, when combined with Geographic Information Systems (GIS), it can illuminate factors affecting real estate prices. Patterns emerge by overlaying property values on a map and integrating demographic, economic, and infrastructural data. Analysts can identify areas with rising property values or predict the next “hotspot[11].”
That said, cartographic maps alone shouldn’t be the be-all, end-all of price forecasting. It should be used alongside other market research methods for a more comprehensive understanding of price trends.
How do cartographic maps ensure accurate property boundary delineations?
Cartographic maps, especially those derived from precise surveying techniques, provide clear demarcations of property boundaries. These maps reduce disputes between property owners and ensure legal clarity. When combined with land registry data, they offer a reliable source of information for property sales, purchases, and development.
That said, property boundaries may not always be updated[12], so the accuracy of a digitally prepared map is only as good as the data fed to it.
Sources
- Billock, J. (2017, July 18.) Where to See Some of the World’s Oldest and Most Interesting Maps. The Smithsonian Magazine. Retrieved from https://www.smithsonianmag.com/travel/where-see-some-worlds-oldest-maps-180963855/
- The Cartography Tools Of Our Past. (2022, September 2.) Land.id. Retrieved from https://web.id.land/blog/the-cartography-tools-of-our-past
- Slater, S. (2020, March 4.) How 3D Mapping, VR/AR, and IoT are Transforming Wayfinding, Recruiting and Training. Concept3D. Retrieved from https://concept3d.com/blog/digital-maps/how-3d-mapping-vr-ar-and-iot-are-transforming-wayfinding-recruiting-and-training/
- Abrosymova, K. (2015, August 4.) What Technology Stack do Zillow, Redfin and Realtor.com Use for Property Listings? Medium. Retrieved from https://medium.com/yalantis-mobile/what-technology-stack-do-zillow-redfin-and-realtor-com-use-for-property-listings-b6b1ba695618
- Harris, W. (n.d.) How Urban Planning Works. HowStuffWorks. Retrieved from https://science.howstuffworks.com/environmental/green-science/urban-planning.htm
- Satellite Navigation – Global Positioning System (GPS). (2022, December 27.) Federal Aviation Administration. Retrieved from https://www.faa.gov/about/office_org/headquarters_offices/ato/service_units/techops/navservices/gnss/gps
- Acharjee, S. (2021, March 30.) Trilateration vs Triangulation: An Interesting Guide (2021). UNext. Retrieved from https://u-next.com/blogs/cloud-computing/trilateration/
- Rushton, D. (2020, August 12.) Raster vs Vector Maps: What’s the Difference & Which are Best? Carto.com. Retrieved from https://carto.com/blog/raster-vs-vector-whats-the-difference-which-is-best
- Dempsey, C. (2023, August 26.) Understanding Map Scale. GIS Lounge. Retrieved from https://www.gislounge.com/understanding-scale/
- Map Design & Cartography at the EPA. (n.d.) Environmental Protection Agency. Retrieved from https://www.epa.gov/geospatial/map-design-cartography-epa
- Davis, G.B. (2023, October 17.) Heat Map: The Hottest Real Estate Markets in Q4 2023. SparkRental. Retrieved from https://sparkrental.com/hottest-real-estate-markets/
- Frequently Asked Questions. (n.d.) LinkGIS. Retrieved from https://linkgis.org/about/contact-us/frequently-asked-questions/
