What Is Year-Over-Year (YOY)?
REtipster does not provide tax, investment, or financial advice. Always seek the help of a licensed financial professional before taking action.
Shortcuts
- Year-over-year (YOY) compares the performance of a specific period to the identical period one year earlier to measure growth.
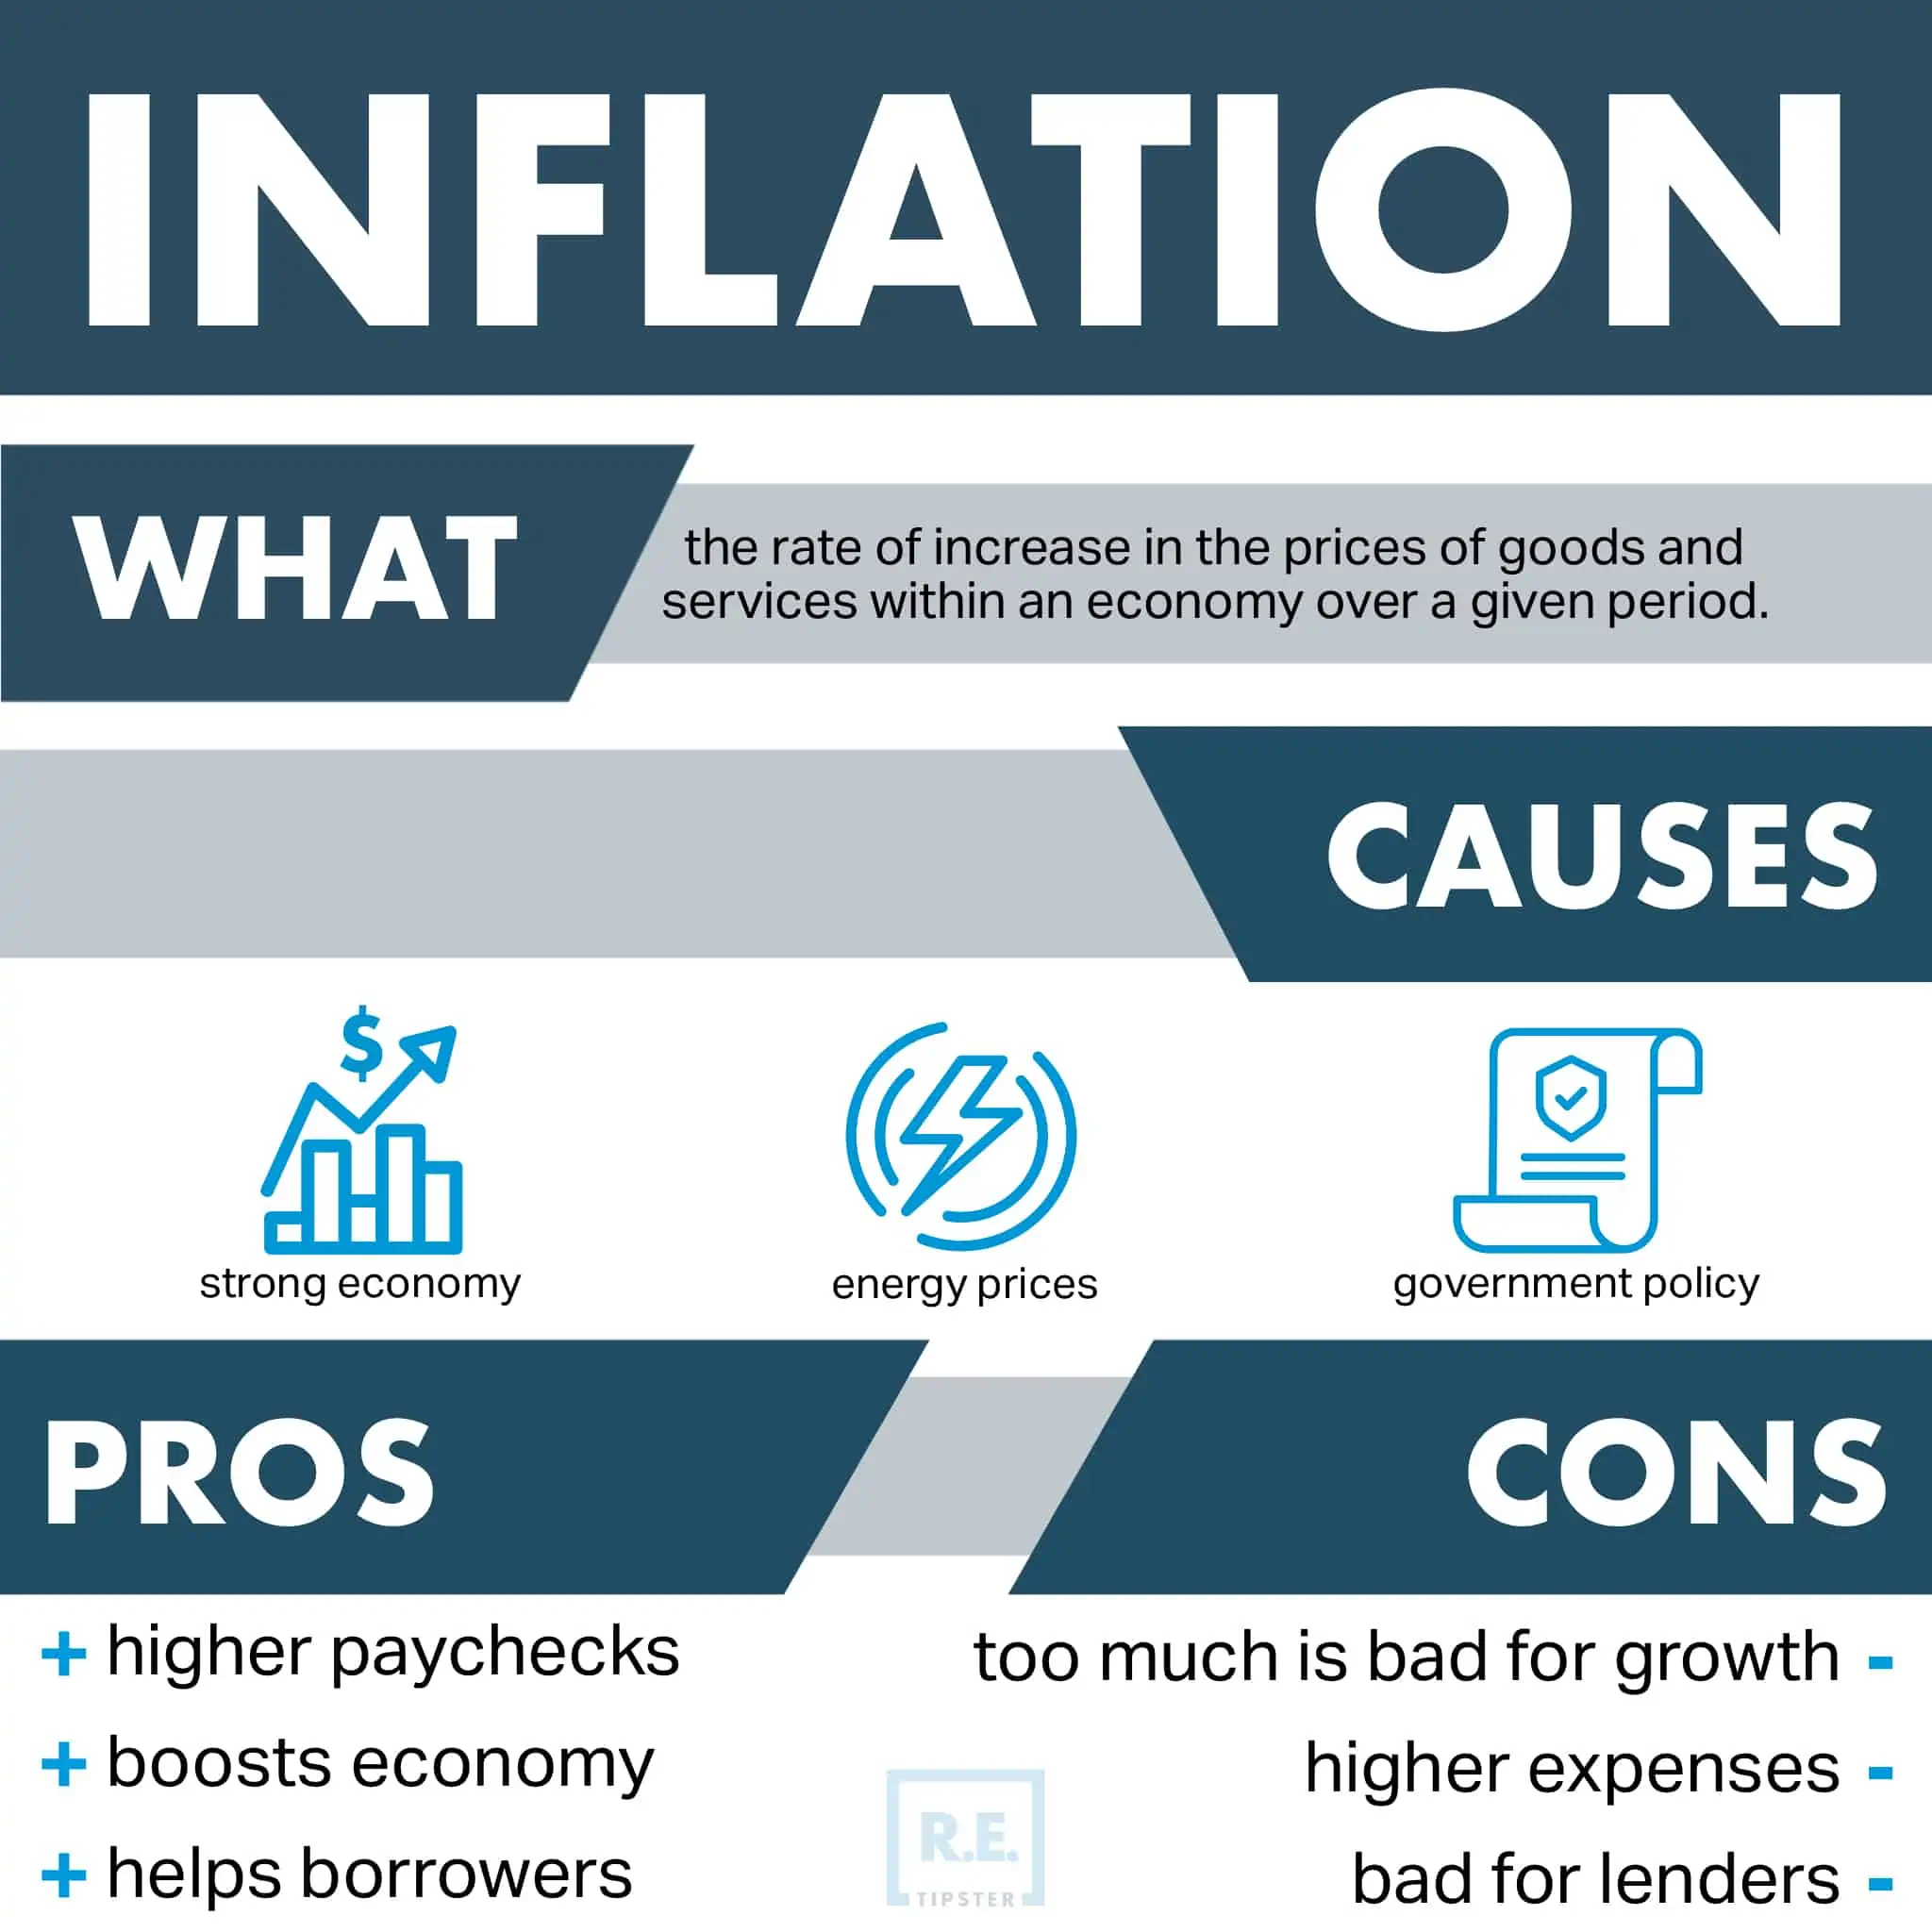
- For example, an 8% inflation rate represents YOY growth, indicating that the prices of goods and services increased by 8% compared to exactly one year ago.
- To calculate YOY, divide the data for a specific month or quarter by the data for the corresponding month or quarter from the previous year, and then subtract 1.
- The interpretation of negative YOY data depends on the metric you’re assessing—it can be encouraging or concerning.
Year-Over-Year Example
A year-over-year example is a 6% increase in the gross domestic product[1].
For instance, if a country’s economy grew by 6% in the first quarter of the current year, it was 6% smaller in the first quarter of the preceding year.
This means that the total value of finished goods and services produced within the country’s borders increased, generally viewed as a positive outcome.
Another YOY example is an inflation rate of 8%.
Say the prices of goods and services increased by 8% in the current year, you would have been able to purchase the same items for 8% less twelve months ago, indicating that prices have risen. If your income didn’t grow at the same rate, it also implies that your purchasing power has decreased.
As you can see, you may use YOY to measure anything you can count, enabling you to gauge whether it’s improving, stabilizing, or deteriorating over time. This helps you understand macroeconomics, assess the financial well-being of companies, or analyze any measurable and trackable variables.
YOY growth remains unaffected by the seasonal patterns in consumer behavior, enabling more meaningful and precise performance comparisons over time.
How Do You Calculate Year Over Year?
To calculate year over year, use this formula:
YoY = ([Current Year Value / Previous Year Value] – 1) x 100
For example, suppose the population of a metropolitan statistical area (MSA) increased from 800,000 in September of the previous year to 950,000 in September of this year. The YOY growth for this period is 18.75%.
- YOY = ([950,000 / 800,000] – 1) x 100
- YOY = ([1.1875]) – 1) x 100
- YOY = (0.1875) x 100
- YOY = 18.75
For comparisons covering less than a year, you can calculate quarter-over-quarter (QOQ) or month-over-month (MOM) growth instead. Both methods use the same formula as YOY, but with shorter gaps of 3 months and 1 month, respectively, between the figures.
In the given example, if the MSA’s September population increased to 820,000 in October and 840,000 in December of the same year, it indicates a 5% month-over-month (MOM) increase and a 2.5% quarter-over-quarter (QOQ) increase.
What Does a Negative YOY Mean?
A negative YOY indicates that the current figure is lower than last year’s.
Generally, YOY is neither good nor bad; its significance depends on the metric being assessed. For instance, a negative YOY can be encouraging when evaluating negative metrics like crime rate reduction, but it may be concerning when analyzing positive metrics like net income growth.
For instance, a company that experienced a -5% YOY net loss in a specific quarter would be considered successful in reducing its losses compared to the same quarter last year.
On the other hand, a positive YOY in terms of global carbon dioxide emissions indicates an increase in pollution levels from the previous year. Therefore, even though it’s a positive number, it’s still a negative outcome for society as a whole[3].
What Is a Good Year-Over-Year Growth Rate?
Again, a good YOY growth rate depends on the context and the specific metric, as explained below.
Inflation
A good year-over-year growth rate for inflation is around 2%[4].
Surprisingly, many economists prefer inflation to deflation because a stable rise in prices encourages consumer spending, which, in turn, fosters economic growth[5].
Gross Domestic Product (GDP)
A healthy YOY GDP growth falls between 2% to 3%[6]. While economies can expand faster, rapid growth might be worrisome as it could lead to asset bubbles[7].
On the other hand, an economy can’t remain stagnant or shrink, as that may trigger a recession[8].
Unemployment
Most policymakers aim to keep the unemployment rate below 5% throughout the year[9].
Business Growth
In the context of business growth, higher YOY rates are generally better.
However, growth must also be sustainable. A company experiencing an upward trend in sales may not necessarily be positive if it fails to generate enough profit to sustain its operations[10].
YOY vs. YTD
Year-over-year compares a specific metric or performance measure from 12 months ago to the current date, while year-to-date (YTD) shows a company’s performance from the beginning of the current year to the present day.
Both ranges cover 12 months. However, YTD starts on the first day of the calendar or fiscal year, whereas YOY can consider any month or quarter as a benchmark.
YTD is a suitable alternative to YOY when you don’t need to compare the growth or decline from the previous year to the present. For example, investment managers track YTD data to predict asset prices, while businesses planning to hire more employees review their YTD payroll figures to estimate additional costs for benefits and taxes.
Year-on-Year or Year Over Year
Comparing figures from the same months in different years can be termed “year-over-year.” The terms “year-over-year” and “YOY” are interchangeable and refer to the same concept.
Sources
- Stone, C. (2017, April 27.) Economic Growth: Causes, Benefits, and Current Limits. Center on Budget and Policy Priorities. Retrieved from https://www.cbpp.org/research/economy/economic-growth-causes-benefits-and-current-limits
- Iacurci, G. (2022, May 12.) How fast does inflation cut buying power? Here’s a simple guide. CNBC. Retrieved from https://www.cnbc.com/2022/05/11/how-fast-does-inflation-cut-buying-power-heres-a-simple-guide.html
- Global carbon emissions need to shrink 10 times faster. (2021, March 3.) Standard University. Retrieved from https://earth.stanford.edu/news/global-carbon-emissions-need-shrink-10-times-faster-0
- What is an acceptable level of inflation? (2011, July 25.) Federal Reserve Board. Retrieved from https://www.federalreserve.gov/faqs/5D58E72F066A4DBDA80BBA659C55F774.htm
- Amadeo, K. (2022, January 20.) Reasons Why Inflation Is Good. The Balance. Retrieved from https://www.thebalancemoney.com/why-is-inflation-good-4065995
- Nguyen, J. (2019, January 30.) 5 things to know about GDP. Marketplace. Retrieved from https://www.marketplace.org/2019/01/30/5-things-know-about-gdp/
- Manfull, Q. (2022, August 30.) 5 Stages of an Asset Bubble. Masterworks. Retrieved from https://insights.masterworks.com/finance/5-stages-of-an-asset-bubble/
- Siegel, R. & Wright, E. (2022, July 28.) What causes a recession? The Washington Post. Retrieved from https://www.washingtonpost.com/business/interactive/2022/what-causes-a-recession/
- Kim, P. (2022, June 10.) The unemployment rate: A key health indicator for a country’s economy. Insider. Retrieved from https://www.businessinsider.com/personal-finance/unemployment-rate
- Fruhan, Jr., W. (1984, January.) How Fast Should Your Company Grow? Harvard Business Review. Retrieved from https://hbr.org/1984/01/how-fast-should-your-company-grow


